Fig. 2
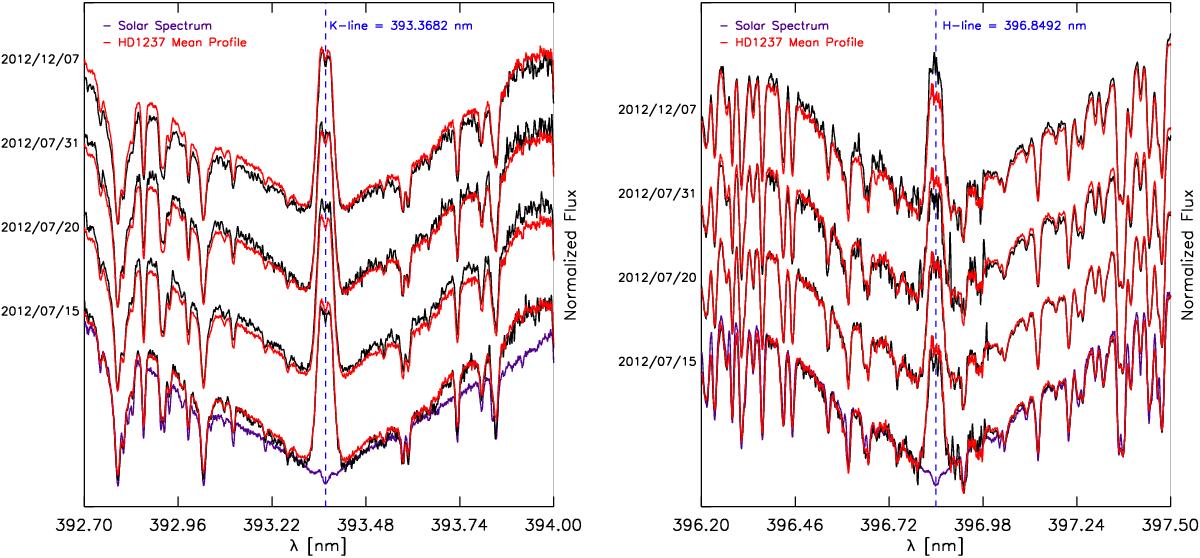
Core regions of the CaII K (left) and H (right) lines of HD 1237. Four spectra from our sample are plotted with the corresponding dates on the left y-axis and vertically shifted (0.25 units) for visualisation purposes. The black spectrum at the top was taken at a much later epoch (2012 Dec. 07). The red line shows the mean profile for the entire dataset, while the purple line is a HARPS solar spectrum used as reference.
Current usage metrics show cumulative count of Article Views (full-text article views including HTML views, PDF and ePub downloads, according to the available data) and Abstracts Views on Vision4Press platform.
Data correspond to usage on the plateform after 2015. The current usage metrics is available 48-96 hours after online publication and is updated daily on week days.
Initial download of the metrics may take a while.