Fig. 9
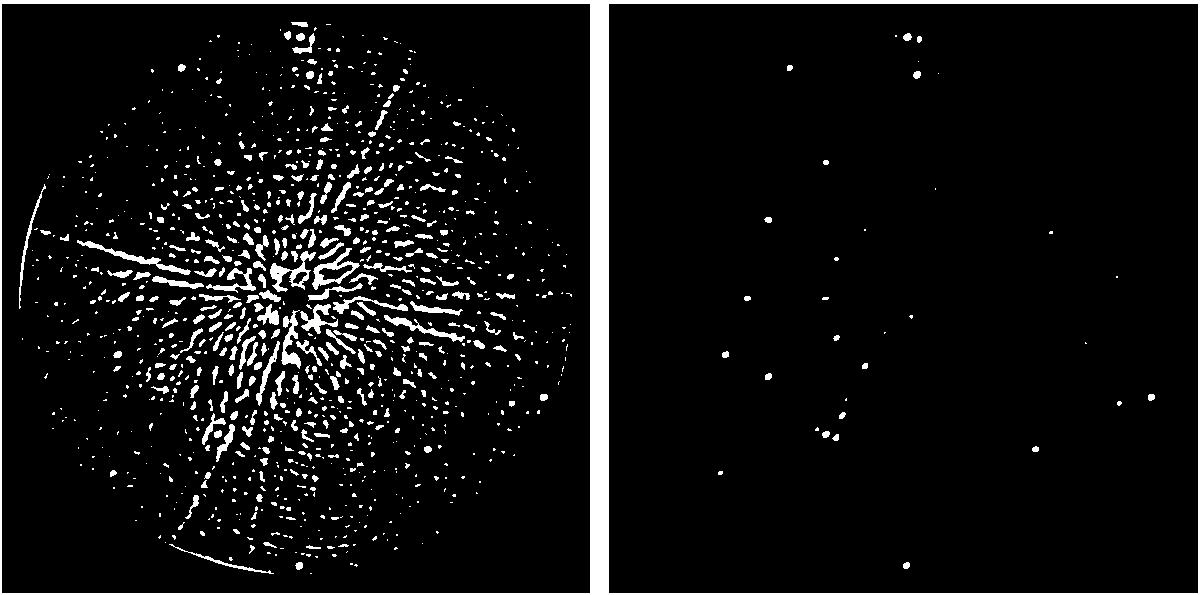
S/N maps that have been thresholded to 5σ. Left: non-normalized thresholded S/N map. We observe that many signals are above threshold (white), mostly close to the center and along the spider diffraction pattern. Right: normalized thresholded S/N map. Here only the probable planetary signals are found above the threshold. It is possible to perform an automatic detection on this map.
Current usage metrics show cumulative count of Article Views (full-text article views including HTML views, PDF and ePub downloads, according to the available data) and Abstracts Views on Vision4Press platform.
Data correspond to usage on the plateform after 2015. The current usage metrics is available 48-96 hours after online publication and is updated daily on week days.
Initial download of the metrics may take a while.