Fig. 8
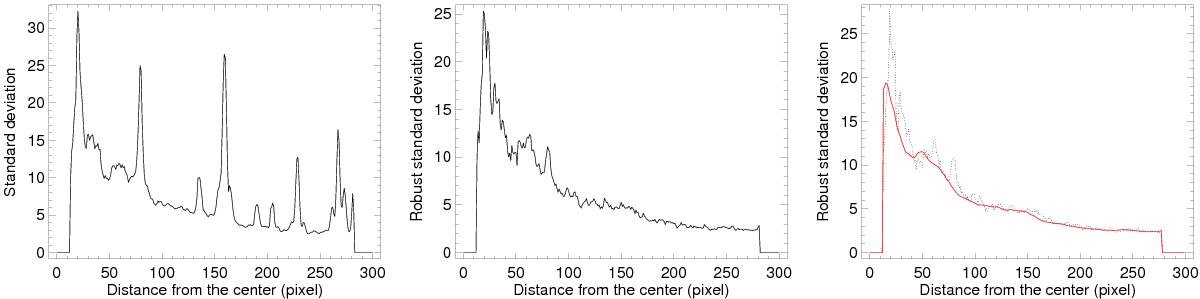
Azimuthal mean standard deviation of the S/N map as a function of the distance to the star TYC-8979-1683-1. Left: regular radial profile of the S/N standard deviation. We can visualize the high peaks indicating the presence of companions at certain separations. Middle: radial profile of the S/N robust standard deviation. The highest peaks have disappeared but the profile is still jagged. Right: radial profile of the S/N robust standard deviation smoothed over 18 pixels to obtain the global trend of the S/N map standard deviation deprived of its companions. The ANDROMEDA process reduces the exploitable zone between the IWA (at 13 pixels here since IWA = 4λ/D) and the OWA (at 281 pixels here since OWA = Sizeimage/ 2−NPSF/ 2−dr).
Current usage metrics show cumulative count of Article Views (full-text article views including HTML views, PDF and ePub downloads, according to the available data) and Abstracts Views on Vision4Press platform.
Data correspond to usage on the plateform after 2015. The current usage metrics is available 48-96 hours after online publication and is updated daily on week days.
Initial download of the metrics may take a while.