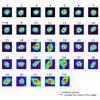
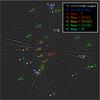
Fig. 4

Images obtained by running the automatic detection module on the output provided by ANDROMEDA applied to the images of TYC-8979-1683-1 taken with the VLT/NaCo instrument (see Sect. 4). The threshold is set at 5σ. Left: S/N map subwindows (11 × 11 pixels) in which the 2D Gaussian fits are performed for each detection. The subimages are classified by decreasing S/N and indexed by an increasing integer from one to the total number of detections above threshold. If the fit could not converge, one asterisk is placed above the corresponding subimage. Otherwise, the two axes of the fitted Gaussian are superimposed and their lengths are equal to the FWHM. Right: S/N map showing the location of each detection in the first image (labeled by their index of detection) as well as their flux range (color of the index) and whether it is an artifact (one asterisk means that the 2D Gaussian fit did not converge; the @ symbol means that it is assessed as a tertiary lobe artifact).
Current usage metrics show cumulative count of Article Views (full-text article views including HTML views, PDF and ePub downloads, according to the available data) and Abstracts Views on Vision4Press platform.
Data correspond to usage on the plateform after 2015. The current usage metrics is available 48-96 hours after online publication and is updated daily on week days.
Initial download of the metrics may take a while.