Free Access
Fig. 3
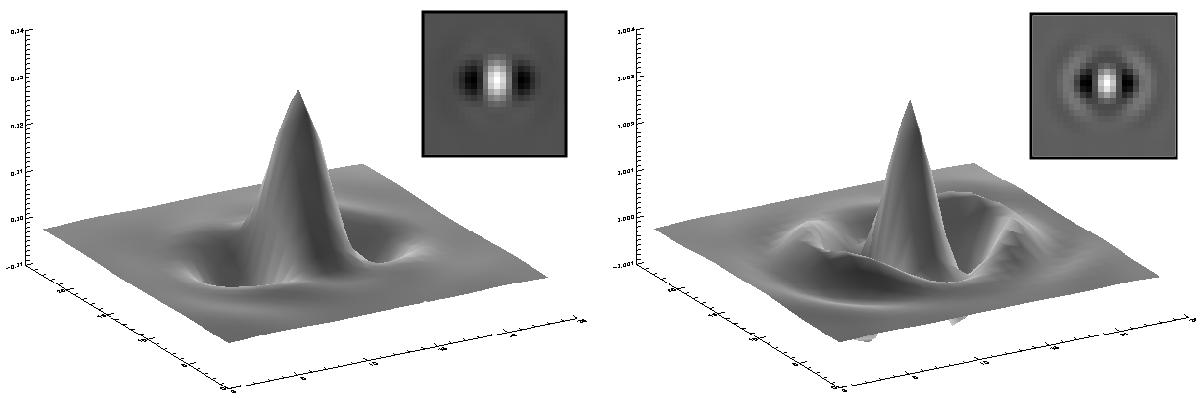
Illustration of the pattern (autocorrelation of the planet signature, Fig. 2) appearing in the maps as evidence of a planetary signal. Left: pattern obtained without filtering the raw images. Right: pattern obtained with high-pass filtering of the raw images (F = 1/4).
This figure is made of several images, please see below:
Current usage metrics show cumulative count of Article Views (full-text article views including HTML views, PDF and ePub downloads, according to the available data) and Abstracts Views on Vision4Press platform.
Data correspond to usage on the plateform after 2015. The current usage metrics is available 48-96 hours after online publication and is updated daily on week days.
Initial download of the metrics may take a while.