Fig. 2
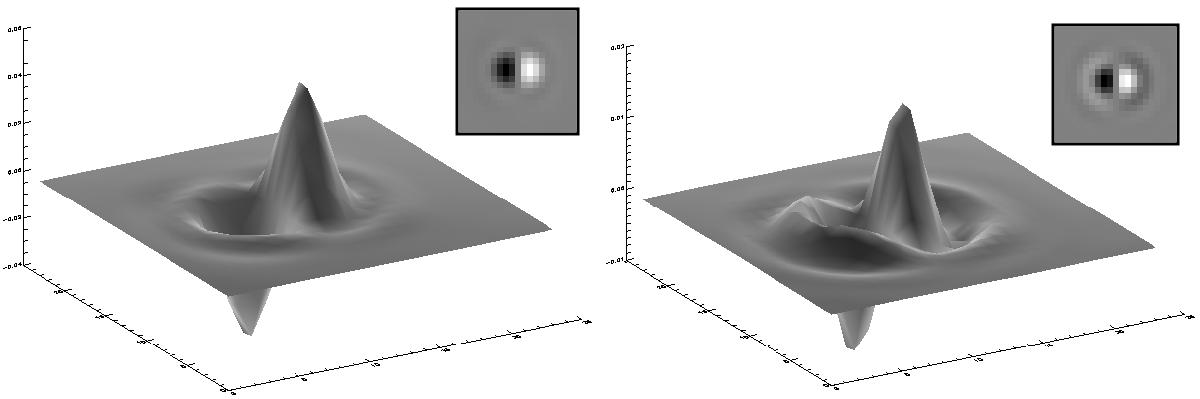
Illustration of the planet signatures obtained when performing the ADI, setting δmin = 0.5λ/D. These have been obtained by simulating two identical noiseless planetary PSF, separated by δmin and then subtracted one from the other. Left: planet signature obtained without high-pass filtering of the raw data. Right: planet signature obtained when the raw data have been filtered of their low frequencies (F = 1/4). This time secondary opposite lobes surround the main lobe.
Current usage metrics show cumulative count of Article Views (full-text article views including HTML views, PDF and ePub downloads, according to the available data) and Abstracts Views on Vision4Press platform.
Data correspond to usage on the plateform after 2015. The current usage metrics is available 48-96 hours after online publication and is updated daily on week days.
Initial download of the metrics may take a while.