Fig. 14
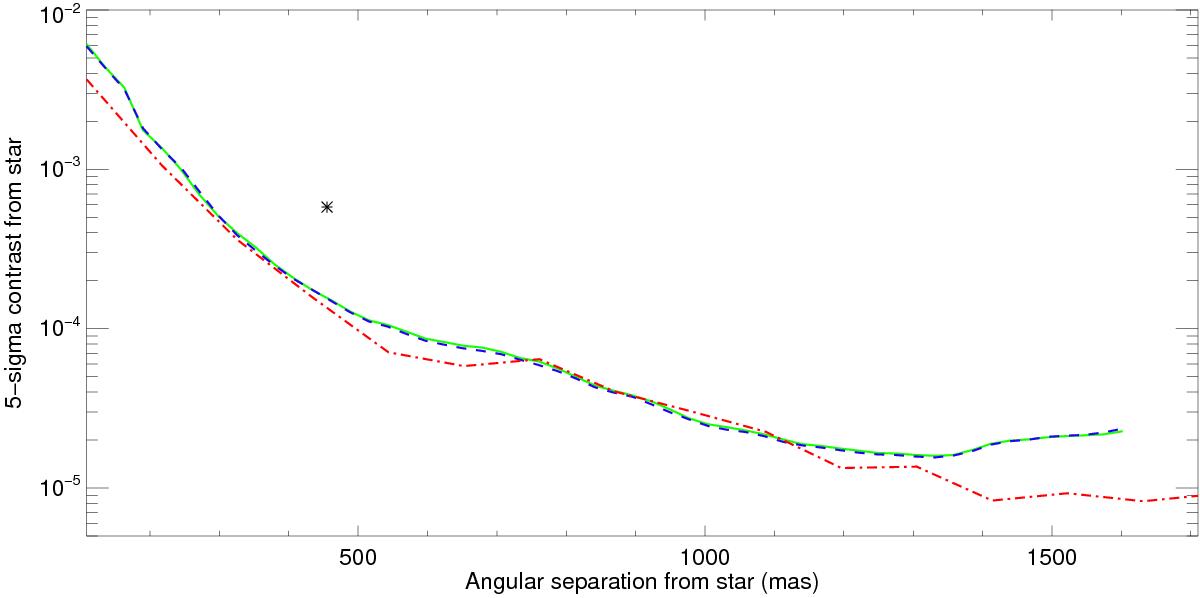
Detection limits at 5σ obtained by processing the β Pictoris data from VLT/NaCo-AGPM with ANDROMEDA (green solid line, when using a L1-affine optimization or blue dashed line when using a LS optimization) or sPCA (red dash-dotted line). The asterisk symbol shows the location of the detected signal above the 5σ threshold set (only β Pictoris b is detected here).
Current usage metrics show cumulative count of Article Views (full-text article views including HTML views, PDF and ePub downloads, according to the available data) and Abstracts Views on Vision4Press platform.
Data correspond to usage on the plateform after 2015. The current usage metrics is available 48-96 hours after online publication and is updated daily on week days.
Initial download of the metrics may take a while.