Fig. 13
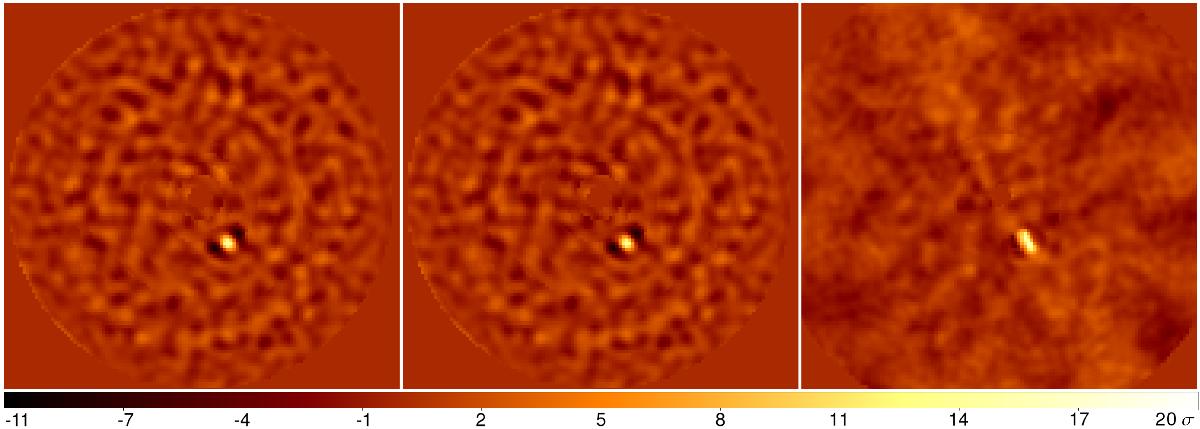
Resulting S/N map of β Pictoris according to two different image processing methods applied on the reduced data. Left: S/N map obtained from ANDROMEDA, using a least-squares optimization for the ADI subtraction. Middle: S/N map obtained from ANDROMEDA, using a L1-affine optimization for the ADI subtraction. The residuals are slightly lower, mostly close to the central part, as explained in Sect. 2.2.1. Right: S/N map obtained with the PCA-KLIP algorithm (see text). All images are linearly scaled. No signal is found above the 5σ threshold in any of the maps, except for the companion β Pictoris b.
Current usage metrics show cumulative count of Article Views (full-text article views including HTML views, PDF and ePub downloads, according to the available data) and Abstracts Views on Vision4Press platform.
Data correspond to usage on the plateform after 2015. The current usage metrics is available 48-96 hours after online publication and is updated daily on week days.
Initial download of the metrics may take a while.