Fig. 12
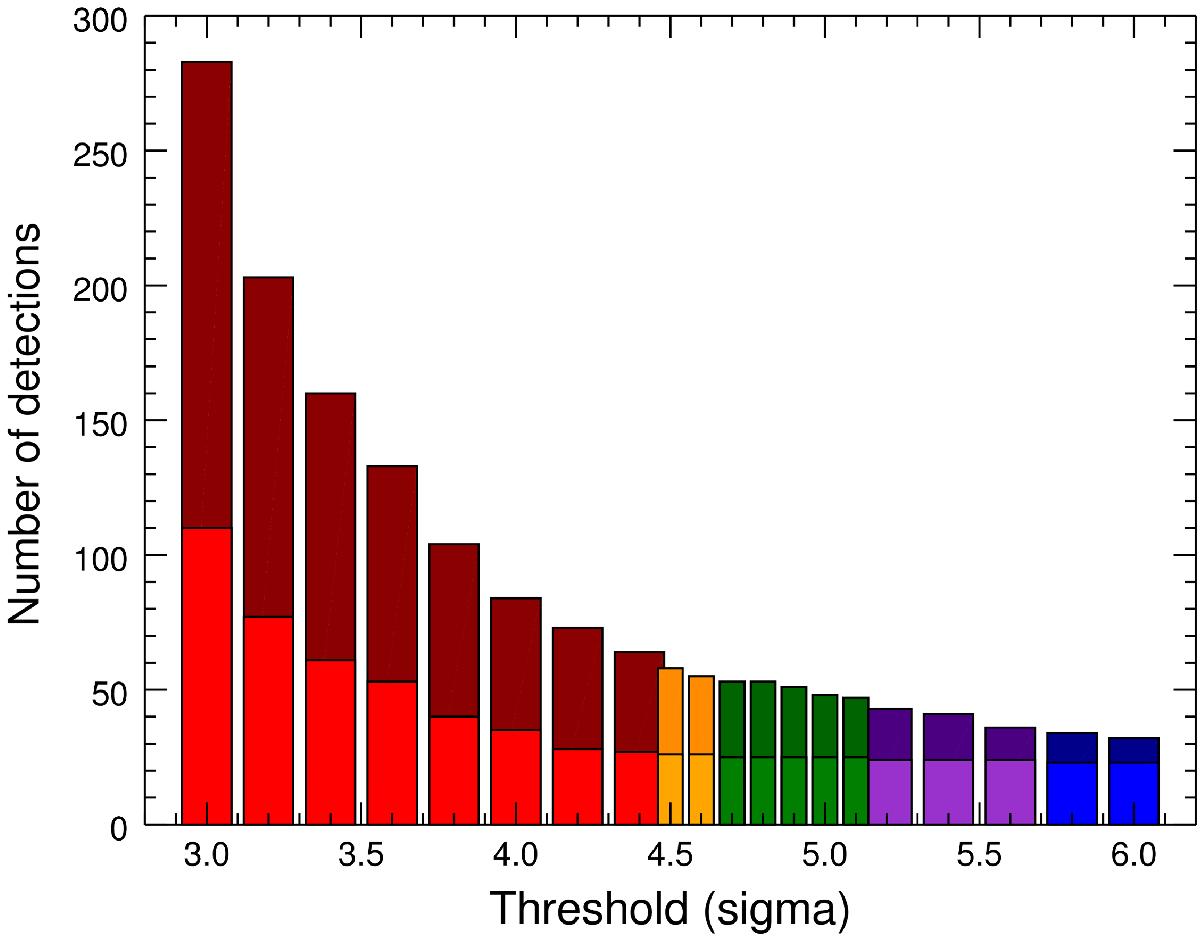
Number of total detections (dark color) and of confirmed detections (light color) as a function of the threshold set for the TYC-8979-1683-1 NaCo images. The optimal zone (where all 25 companions are detected) is shown in green. A false alarm zone is shown in red (more than one false detection) and orange (one false detection) and a loss zone in blue (more than one true companion is not detected) and purple (one true companion is not detected).
Current usage metrics show cumulative count of Article Views (full-text article views including HTML views, PDF and ePub downloads, according to the available data) and Abstracts Views on Vision4Press platform.
Data correspond to usage on the plateform after 2015. The current usage metrics is available 48-96 hours after online publication and is updated daily on week days.
Initial download of the metrics may take a while.