Fig. 9
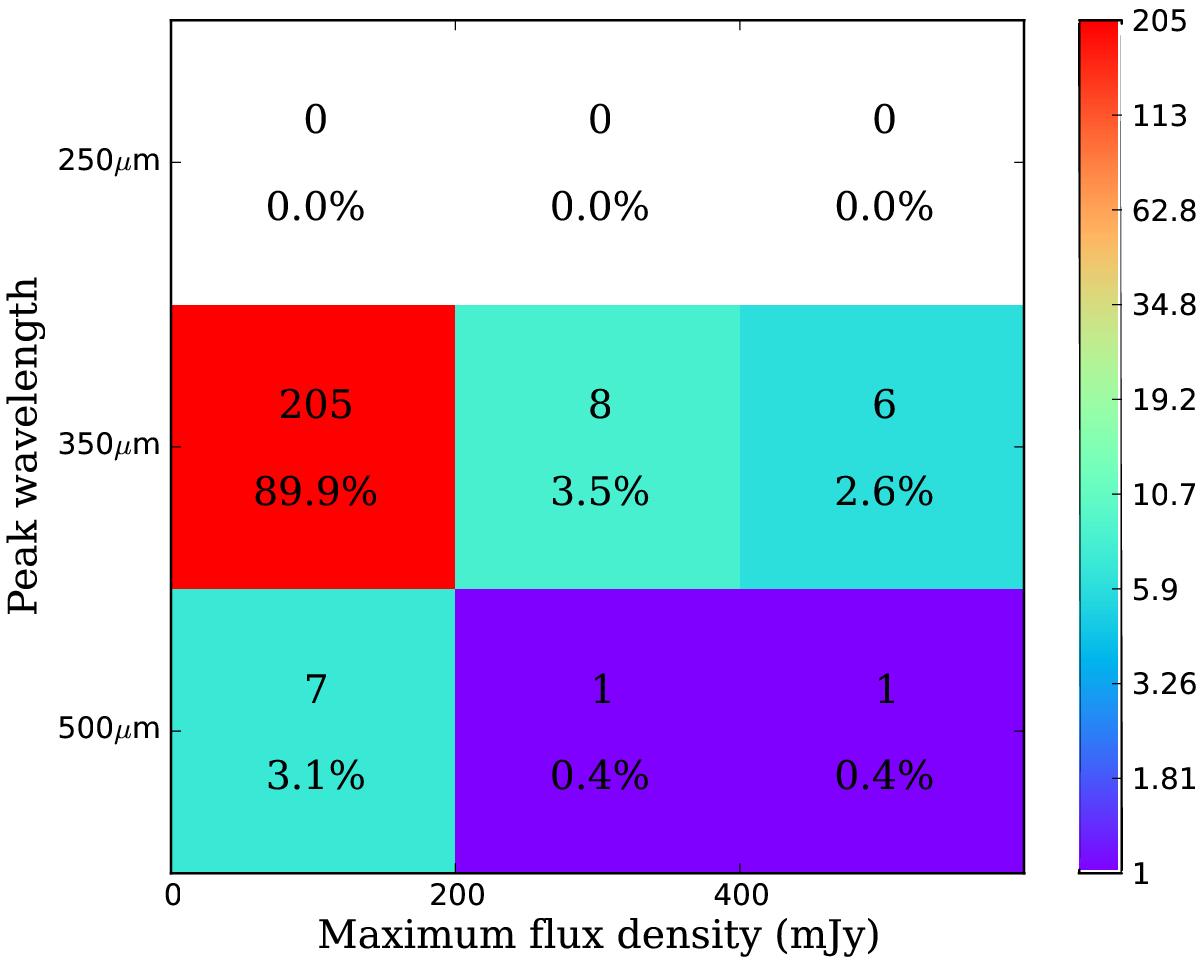
Classification of 228 Planck fields with Herschel-SPIRE. The x-axis represents the maximum flux of the SPIRE source within the IN region: lensed source candidates are selected if they fall above 400 mJy (i.e., the right column, seven sources). The y-axis represents the wavelength at which the brightest SPIRE source peaks in the IN region. Overdensities are thus selected in the lower left four cells. The colour represents the number of fields in each cell (as shown in the colour bar). the numbers in the cells are the number of fields and percentage in each cell. Our sample is thus dominated by overdensities peaking at 350 μm. See Sect. 4.4 for details.
Current usage metrics show cumulative count of Article Views (full-text article views including HTML views, PDF and ePub downloads, according to the available data) and Abstracts Views on Vision4Press platform.
Data correspond to usage on the plateform after 2015. The current usage metrics is available 48-96 hours after online publication and is updated daily on week days.
Initial download of the metrics may take a while.