Fig. 7
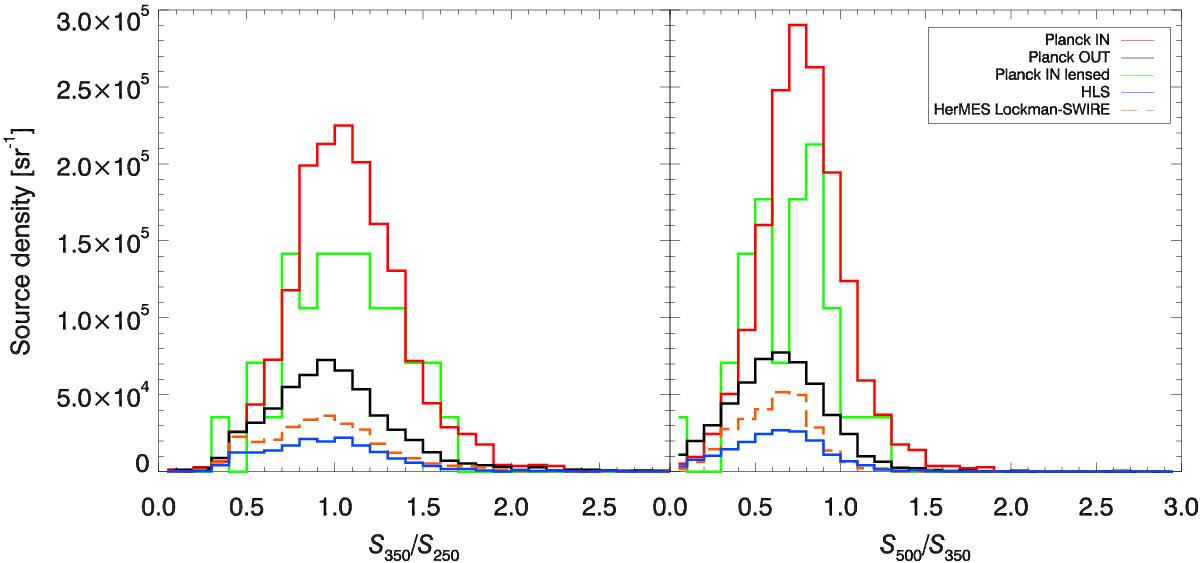
Colour counts: source surface density as a function of the SPIRE colour, S350/S250 (left), and S500/S350 (right). Histograms are: red solid line, Planck IN; black line, Planck OUT; green, Planck IN lensed fields only; blue line, z< 1 HLS clusters; and orange dashes, Lockman SWIRE. The Planck IN sources (total and/or lensed sources) show a much higher surface density than other samples, owing mainly to our all-sky search strategy. See Sect. 4.3 for details.
Current usage metrics show cumulative count of Article Views (full-text article views including HTML views, PDF and ePub downloads, according to the available data) and Abstracts Views on Vision4Press platform.
Data correspond to usage on the plateform after 2015. The current usage metrics is available 48-96 hours after online publication and is updated daily on week days.
Initial download of the metrics may take a while.