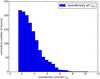
Fig. 6
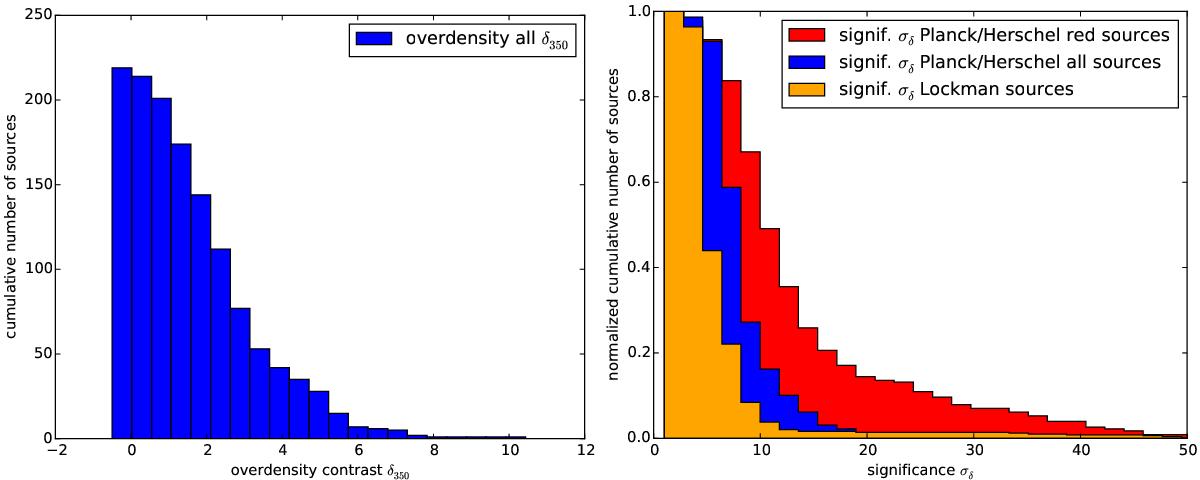
Left: cumulative histogram of the overdensity contrast δ350 (blue) of each Planck field (based on 350μm SPIRE sources). Overdensities are fairly large, with 59 fields having δ350> 3. Right: Cumulative (normalized) statistical significance in σ derived from the density maps. Blue represents all our SPIRE sources, red represents only redder SPIRE sources, defined by S350/S250> 0.7 and S500/S350> 0.6, and orange 500 random fields in Lockman. Most of our fields have a significance greater than 4σ, and the significance is higher still for the redder sources. See Sect. 4.2 for details.
Current usage metrics show cumulative count of Article Views (full-text article views including HTML views, PDF and ePub downloads, according to the available data) and Abstracts Views on Vision4Press platform.
Data correspond to usage on the plateform after 2015. The current usage metrics is available 48-96 hours after online publication and is updated daily on week days.
Initial download of the metrics may take a while.