Fig. 1
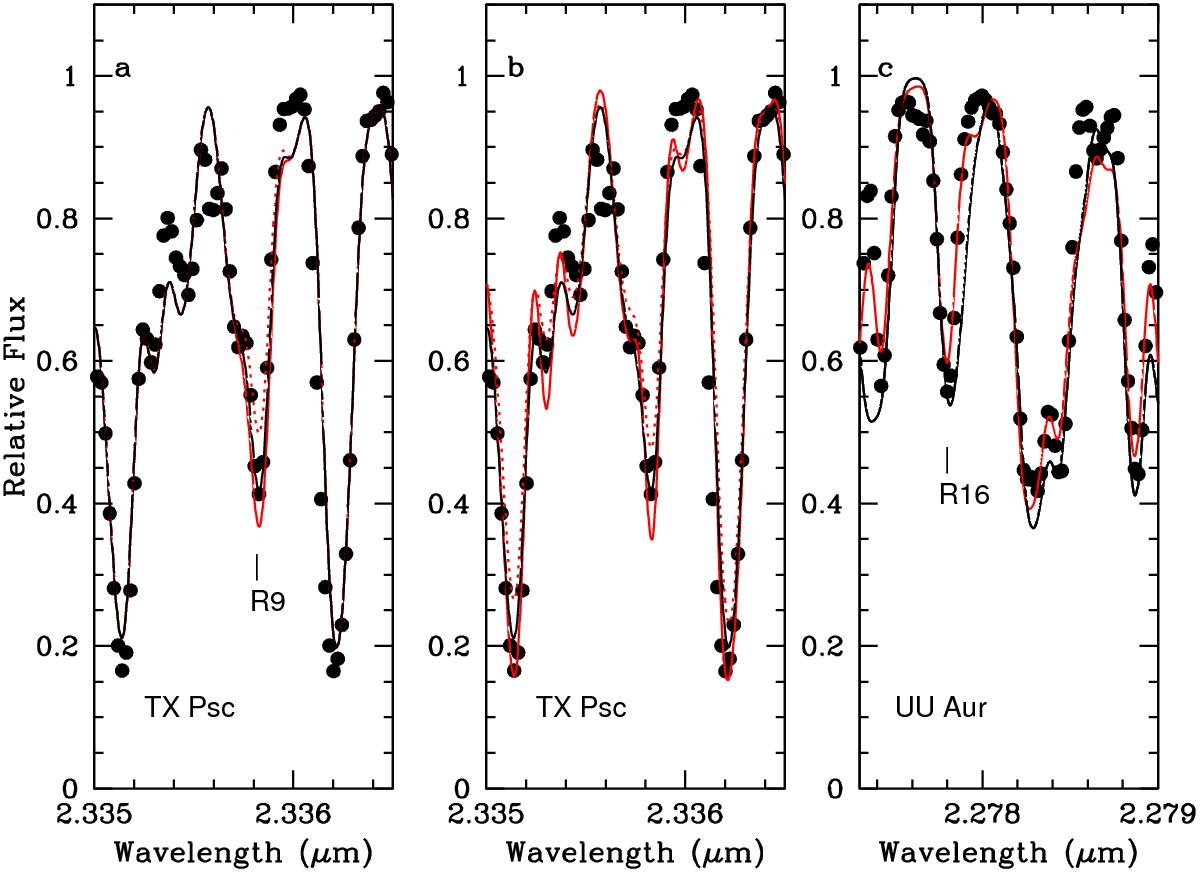
Examples of synthetic fits (continuous and dotted lines) to the observed spectra (dots) for typical AGB carbon stars in the region of some HF lines. Panel a) (left): black line is the best fit to the R9 HF line in TX Psc (log ϵ(F) = 4.7,ξ = 2.2 km s-1 and Γ = 13 km s-1); red line is a fit assuming a 0.45 dex larger F abundance to show the effect of a F abundance variation similar to the total error estimated on [F/H] (see text); and the dotted red line shows the corresponding synthetic spectrum adopting the previously wrong lower excitation energy for this line, χ = 0.48 eV. Panel b) (centre): black line the same as case a; red line is a synthetic spectrum adopting a lower macroturbulence parameter Γ = 11 km s-1; and the dotted red line adopts a lower microturbulence, ξ = 1.8 km s-1 than in case a, respectively. Panel c) (right): effect of our new CN line list (black line) compared with the older line list (red line) on the fit to the R16 HF line at λ ~ 2.2778μm in the carbon star UU Aur.
Current usage metrics show cumulative count of Article Views (full-text article views including HTML views, PDF and ePub downloads, according to the available data) and Abstracts Views on Vision4Press platform.
Data correspond to usage on the plateform after 2015. The current usage metrics is available 48-96 hours after online publication and is updated daily on week days.
Initial download of the metrics may take a while.