| Issue |
A&A
Volume 581, September 2015
|
|
|---|---|---|
| Article Number | A76 | |
| Number of page(s) | 5 | |
| Section | Extragalactic astronomy | |
| DOI | https://doi.org/10.1051/0004-6361/201526496 | |
| Published online | 07 September 2015 | |
The naked nuclei of low ionization nuclear emission line regions
1 Dipartimento di Fisica e Astronomia, Università di Firenze, via G. Sansone 1, 50019 Sesto Fiorentino (Firenze), Italy
e-mail: This email address is being protected from spambots. You need JavaScript enabled to view it.
2 INAF–Osservatorio Astrofisico di Arcetri, Largo Enrico Fermi 5, 50125 Firenze, Italy
3 INAF–Osservatorio Astrofisico di Torino, via Osservatorio 20, 10025 Pino Torinese, Italy
Received: 8 May 2015
Accepted: 1 July 2015
Abstract
We analyze HST spectra and Chandra observations of a sample of 21 low ionization nuclear emission line regions (LINERs), at least 18 of which genuine active galactic nuclei. We find a correlation between the X-rays and emission lines luminosities, extending over three orders of magnitude and with a dispersion of 0.36 dex; no differences emerge between LINERs with and without broad lines, or between radio-loud and radio-quiet sources. The presence of such a strong correlation is remarkable considering that for half of the sample the X-ray luminosity can not be corrected for local absorption. This connection is readily understood since the X-ray light is associated with the same source producing the ionizing photons at the origin of the line emission. This implies that we have a direct view of the LINERs nuclei in the X-rays: the circumnuclear, high column density structure (the torus) is absent in these sources. Such a conclusion is also supported by mid-infrared data. We suggest that this is due to the general paucity of gas and dust in their nuclear regions that causes also their low rate of accretion and low bolometric luminosity.
Key words: galaxies: active / galaxies: nuclei
© ESO, 2015
1. Introduction
The presence of low ionization nuclear emission line regions (LINERs), initially identified by Heckman (1980), is very common in galaxies but their nature is still matter of debate. This is because several processes, beside an active nucleus, produce a low ionization spectrum, such as shocks (as initially proposed by Heckman 1980) or evolved stellar populations (Trinchieri & di Serego Alighieri 1991; Binette et al. 1994). In high spatial resolution X-ray images, about 60% of LINERs show a nuclear compact source (González-Martín et al. 2009), however, the emission from the supermassive black holes can account for only ~60% of the ionizing photons, and therefore the AGN emission alone is not enough to power the optical emission lines (Flohic et al. 2006; Eracleous et al. 2010). These results are confirmed by the CALIFA survey: the integral field spectroscopy images show the presence of extended regions characterized by a low ionization spectrum; however, the radial emission-line surface brightness profiles are inconsistent with ionization by a central point-source and this is most likely due to the effects of post-AGB stars (Singh et al. 2013). It is then unclear whether LINERs (or which portion of this heterogeneous class) are powered by accretion onto a supermassive black hole.
Even considering the LINERs that are genuine active galactic nuclei (AGN), we then still need to understand how they compare with the general AGN population. For example, whether the orientation based unified model (e.g. Antonucci 1993) also applies to LINERs, i.e., if the detection of a broad line region (BLR) is related to the effects of a circumnuclear obscuring structure (Balmaverde & Capetti 2014).
A widely used tool to investigate the nature of AGN is the ratio between the X-rays and the line luminosities. Maiolino et al. (1998) found that the LX/L[O III] ratio differs by a factor ~100 in Seyferts type 1 and type 2, the former class showing the largest values. This is interpreted as evidence of nuclear absorption in the X-rays emission in Seyferts 2, since the [O III] emission is a robust (and isotropic) estimator of the AGN bolometric luminosity. Risaliti et al. (1999) found that in the Seyferts 2 the local column density, NH,z, exceeds 1023 cm-2 in all but two of 35 sources considered. Seyferts 2 show multiwavelength properties analogous to those of Seyferts 1 only when absorption is taken into account. For example, Krabbe et al. (2001) found a tight correlation between the 10 μm (similar to the emission lines, the MIR light is radiated almost isotropically) and the X-ray luminosities, followed by both Seyferts 1 and 2. In most LINERs the quality of the X-ray spectra is insufficient to measure NH,z directly, and they span a very large wide range of LX/L[O III] values (González-Martín et al. 2009), even broader than in Seyfert galaxies. We still need to establish how LINERs fit into this scheme.
These issues can be explored in greater depth by studying the nuclear emission in LINERs at the highest available spatial resolution. Indeed, a key problem with LINERs is that they are faint objects and, hence, subject to strong contamination from the host galaxy. In this paper we perform an analysis on a sample of LINERs based on HST and Chandra data. Our aim is to isolate their genuine nuclear contribution in the X-rays and to perform the best possible decomposition between the galactic and (if present) the AGN emission lines.
2. Sample selection and data analysis
We consider the 60 galaxies robustly classified as LINERs by Ho et al. (1997) from their spectroscopic survey of bright nearby galaxies (Filippenko & Sargent 1985; Ho et al. 1995). We select the objects for which both HST/STIS spectroscopic data and Chandra observations are available. We find 21 objects, having discarded five sources (namely NGC 4261, NGC 4314, NGC 4594, NGC 4138 and NGC 4374) because of the poor quality of the HST spectra or because the slit was not centered on the nucleus. The main properties of these galaxies are listed in Table 1. This sample, albeit small, provides us with a broad representation of the LINERs population in terms of luminosity, host galaxy type, and the presence of objects with and without broad lines; it also includes both radio-loud (RL) and radio-quiet (RQ) objects1.
Multiwavelength properties of the sample.
We analyze the STIS spectra public in the Hubble Legacy Archive (see Table 1) focusing on those spectra including the [O III]λ5007 line or, when not available, the Hα and [N II] λ6584 lines. When possible, we combine multiple observations to remove cosmic rays and bad pixels. From the calibrated data, we extract the nuclear spectrum from a synthetic aperture of 0.̋15. The fit to the emission lines is performed with the IDL routine mpfit that employs a χ2 minimization procedure, modeling each line with a Gaussian profile. The [N II] doublet ratio is fixed to the expected value of 1:3 (Humphrey et al. 2008), while the widths of [N II] and Hα are assumed to be equal. The continuum emission is reproduced with a first degree polynomial. For the five type 1 AGN, we add a broad Hα component with a skewed Gaussian profile (see Balmaverde & Capetti 2013; and Balmaverde & Capetti 2014 for the methods of spectra reduction and analysis). In Table 1 we report the luminosities of the [O III] and [N II] lines and, for comparison, the [O III] luminosity measured by Ho et al. (1997).
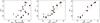 |
Fig. 1 Logarithm of the X-rays luminosity in the 2–10 keV band versus [O III] luminosity (both in erg s-1) measured from ground-based (left) and HST observations (middle), and (right) only for objects with direct [O III] HST measurements. Type 1 LINERs shown with red circles, type 2 objects shown with black circles. The objects for which the [O III] luminosity is derived from the [N II] measurements are marked with smaller green circles. The squares are the RL LINERs. The circles surround objects where LX is corrected for local aborption. In the central and right panel, the solid lines represent the best linear fit. The dashed red line in the central panel is the correlation found for Seyferts by Panessa et al. (2006). |
For the Chandra observations, all measurements are collected from the literature. The only exception is NGC 1961, which we analyze following the same strategy as in Balmaverde & Capetti (2013). In Table 1 we list the X-rays nuclear luminosities and the estimates of the local absorbing column density, NH,z.
3. X-rays and emission lines luminosities.
Balmaverde & Capetti (2013) show that low-luminosity AGN can be isolated from the general population of line emission galaxies by considering their HST and Chandra observations. In particular, AGN show the presence of a nuclear X-ray source and [O III] line with an equivalent width larger than 2 Å (smaller EW values can be produced by stellar processes). Eighteen of the 21 selected LINERs fulfill both criteria, the exceptions being NGC 3368, NGC 4636, and NGC 4736.
In NGC 3368, the [O III] line is not detected and there is no evidence for a nuclear X-ray source. NGC 4636 is not detected in the Chandra data (Flohic et al. 2006; Loewenstein et al. 2001; González-Martín et al. 2009), but its large [O III] EW (13 Å) suggests that it might be a genuine AGN. NGC 4736 is a very peculiar source: it shows a broad Hα line, with a width of only 1570 km s-1 and a luminosity of 2.2 × 1037erg s-1 (Constantin & Seth 2012). Izotov et al. (2007) show that broad lines of this low width and luminosity are often observed in nonactive galaxies and are produced by young (luminous blue variable or O) stars. Indeed, Eracleous et al. (2002) argue, based on the analysis of its Chandra observations, that there is no compelling evidence for the presence of an AGN in this source, and that the X-rays are produced by a dense cluster of young stellar sources. The low [O III] EW (0.9 Å) further supports this conclusion.
We can now proceed to the analysis of the 18 LINERs that are bonafide AGN. The best suited optical line to estimate the AGN power is [O III]λ5007, which is less affected, with respect to lines of lower level of ionization by the effects of stellar sources, and in particular of young stars. Nonetheless, we prefer to include also objects where only [N II] data are available to increase the sample size. Spectra covering both the [O III] and [N II] lines are available for 12 objects of the sample. The median ratio between the two lines is 0.33, with a dispersion of a factor 2. We use this value to estimate the [O III] intensity for the objects lacking of a direct measurement. The uncertainties in the lines luminosities are dominated by the accuracy of the absolute calibration of STIS of the order of ~10% (Biretta et al. 2015).
The X-rays luminosities have been corrected for absorption in the nine sources where the counts in the Chandra data are sufficient to determine the local absorbing column density, NH,z. For the remaining LINERs the spectra are of insufficient quality to perform a detailed spectral analysis. The quoted luminosity are obtained by fixing the power law index (to 1.7 or 1.8) and NH,z to zero and, consequently, are not corrected for local absorption.
Figure 1 compares the X-rays luminosity in the 2–10 keV band and the [O III] luminosity measured from the ground (left panel), from HST (middle panel), and again from HST data, but only including galaxies with direct [O III] measurements (right panel). Figure 1 shows that when using the ground-based data we see a trend of increase of LX with L[O III]. However, objects with the same level of line emission can differ by a factor ~300 in X-rays. As a result, the ratio log (LX/L[O III]) spans a broad range, from −0.5 to 2.3. Conversely, when using the HST measurements, a clear correlation emerges, extending over about three orders of magnitude. We take the X-ray luminosity errors into account, performing the linear fit to the data with the IDL routine linfit, and obtain
![Mathematical equation: $$ \log L_{\rm X} = (40.25 \pm 0.03)+ (1.14 \pm 0.04)\times (\log L_{\rm[O~III]} -38.5). $$](/articles/aa/full_html/2015/09/aa26496-15/aa26496-15-eq31.png) The dispersion around the fit is 0.36 dex. Since four out of five of the least luminous sources can not be corrected for local absorption, the slope of the correlation could be overestimated. Apparently, there is no distinction between type 1 LINERs with respect to the type 2 or between RL and RQ LINERs. The log (LX/L[O III]) ratios span from 1.1 to 2.3 with an average of 1.7 and a dispersion of 0.4 dex. The LX vs. L[O III] correlation for LINERs is almost parallel to that found for Seyferts by Panessa et al. (2006), with an offset of just 0.5 dex. This is likely due to a different shape of the spectral energy distributions (SED) of LINERs, as suggested by Ho (1999), with a deficit of ionizing photons at a given X-rays luminosity.
The dispersion around the fit is 0.36 dex. Since four out of five of the least luminous sources can not be corrected for local absorption, the slope of the correlation could be overestimated. Apparently, there is no distinction between type 1 LINERs with respect to the type 2 or between RL and RQ LINERs. The log (LX/L[O III]) ratios span from 1.1 to 2.3 with an average of 1.7 and a dispersion of 0.4 dex. The LX vs. L[O III] correlation for LINERs is almost parallel to that found for Seyferts by Panessa et al. (2006), with an offset of just 0.5 dex. This is likely due to a different shape of the spectral energy distributions (SED) of LINERs, as suggested by Ho (1999), with a deficit of ionizing photons at a given X-rays luminosity.
If we only consider the objects with a direct measurement of the [O III] line, we obtain an ever tighter relation (see Fig. 1, right panel), with a dispersion of only 0.2 dex. This indicates that some scatter is due to the indirect estimates of the [O III] luminosity based on the [N II] data.
The difference between the results obtained when using the HST line values as opposed to the ground-based data is because, while for the brightest sources we obtain similar measurements, for the least luminous LINERs, the HST line luminosities are strongly reduced (see Fig. 2). This is likely because the HST data remove the line emission unrelated to the AGN such as, e.g., that associated with the stellar processes discussed in the Introduction. This is particularly important for the least luminous LINERs having the lowest contrast between the AGN and galactic emission.
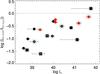 |
Fig. 2 Ratio between the HST and ground-based [O III] luminosity vs. the X-rays luminosity. Symbols as in Fig. 1. |
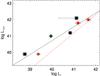 |
Fig. 3 MIR vs. X-rays luminosities for a subsample of seven LINERs. The solid line is the best linear fit, the dashed red line presents the fit obtained for Seyferts by Gandhi et al. (2009). |
The small spread around the LX−L[O III] correlation is remarkable considering the many sources of scatter that are expected to affect it, such as, for example, the X-rays variability. Most importantly, in half of the LINERs the X-ray luminosities cannot be corrected for local absorption and this, not being included in the model, causes an underestimate of the X-rays flux. Simulations performed with PIMMS indicates that the source flux is reduced by 0.23 dex (the scatter of the LX−L[O III] correlation) for NH,z ~ 1022 cm-2. This can be interpreted as the largest value of NH,z that can be present is these sources. The direct estimates available are all (with just one exception) lower than NH,z = 1022.4 cm-2.
Another source of scatter is related to the different linear size of the HST apertures, mainly because of the range of distances among the sources of the sample. Although 15 galaxies are at similar distances, between 8 and 25 Mpc, there are much closer and farther objects. This implies that in LINERs the line measurement is rather stable against different apertures. This is an effect that suggests the dominance of a compact emission line region, confined within a radius smaller that the slit size, typically ~10 pc.
A further support to the idea of a low absorption in LINERs comes from the comparison of the X-ray and mid-infrared (MIR) luminosities. We collected 12 μm ground-based measurements (to be preferred to the Spitzer data for their higher spatial resolution) from Asmus et al. (2014), available for seven LINERs. In Fig. 3 we compare the behavior of our LINERs with respect to the relationship found for local Seyferts (Gandhi et al. 2009). This correlation is obtained for a sample of type 1 and 2 Seyferts spanning an X-ray luminosity range (corrected for obscuration) between ~1041 and ~1045erg s-1. The luminosities in these two bands for LINERs are well correlated and show a ratio similar to those measured in brighter AGN. This again suggests that the X-ray emission is not significantly absorbed. This result is consistent with the same interpretation proposed for Seyferts, i.e., that the MIR emission is due to dust heated by the high energy nuclear photons. The only difference is related to the lower column density of the circumnuclear gas (and, hence, dust) in LINERs.
4. Conclusions
Correlations between emission lines (both considering the broad and narrow components) and continuum intensity in various bands have been found in many studies of AGN (e.g., Adams & Weedman 1975; Netzer et al. 1992; Mulchaey et al. 1994). These are readily understood since the nuclear light is produced by (or directly associated with) the accretion disk, which represents the dominant source of ionizing photons at the origin of the emission lines. These correlations imply that we have a direct view on their nuclei. The AGN where the nucleus is obscured depart from these correlations. This is the case, for example, for Seyferts 2 showing, as reported in the Introduction, a much lower ratio between X-rays and line luminosity with respect to Seyferts 1.
Our results simply recover for LINERs what is already known for the other classes of AGN. The observed correlation requires that the LINERs nuclei are “naked”, i.e., that they are directly visible in the X-rays. This does not imply the lack of any X-rays absorption, but that the obscuring material must be optically thin. Indeed, the direct measurements of the local column density is generally low, reaching only in some sources a few times 1022 cm-2.
Of particular interest is the result that the LINERs with and without a BLR follow the same relation LX−L[O III]. Seyferts 2 do not show a BLR because this is obscured by the torus and these objects show large X-rays absorption. This is not the case for LINERs and the general lack of a BLR in these sources (visible only in five out 18 objects) cannot be due to selective obscuration.
Our results contrast with the claim that a large fraction of LINERs is heavily obscured and even Compton thick (González-Martín et al. 2009), three of these sources belonging to our sample. We believe that the observed large spread in LX/L[O III], and in particular the presence of objects with very low ratios on which the claim of high absorption is based, is because of the heterogeneous measurements of line emission. These come from both imaging and spectroscopic data and are generally obtained from very large apertures, when not integrated over the whole galaxy. The key result of our analysis is that, in these low-luminosity AGN, only the spatial resolution of HST enable us to isolate the genuine AGN line emission.
Another class of AGN shows “naked” nuclei, namely the low-luminosity Fanaroff-Riley type I (FR I) radio galaxies. For these objects, the evidence of the lack of an obscuring torus is based on the high level of detection of optical nuclei (Chiaberge et al. 1999) and on the measurements of low NH,z in their X-rays spectra (Balmaverde et al. 2006), with only four (out of 12) objects showing the presence of significant absorption with values NH,z ~ (0.2−6) × 1022 cm-2. The FR I are characterized by emission line ratios typical of gas of low ionization, i.e., they are radio-loud LINERs. In our sample there are six RL LINERs and they closely follow the LX−L[O III] relation. This result is intriguing, since the multiband correlations found for the nuclear emission in FR I point to a common nonthermal origin.
Most likely due to a lower rate of gas accretion, LINERs are known to be of lower luminosities with respect to Seyferts (Kewley et al. 2006). Various models predict that below a given threshold in Eddington ratio, the radiatively efficient accretion disk typical of powerful AGNs changes its structure into an inner hot and radiatively inefficient flow, possibly an advection-dominated accretion flow, ADAF (e.g., Narayan & Yi 1995), while the standard disk only survives at large radii (Czerny et al. 2004). From an observational point of view, evidence for a truncated disk has been found by modeling their SEDs (Nemmen et al. 2014). This might account for their different optical lines ratios with respect to Seyferts (Nagao et al. 2002; Ho 2008). In particular, the anticorrelation between the hard X-ray photon index and the Eddington ratio in LINERs is qualitatively consistent with the presence of an ADAF (Gu & Cao 2009; Younes et al. 2011).
A BLR is detected only in a minority of LINERs and, at least in the brightest sources, this is likely due to the lack of the high-density clouds needed to form this structure. For example Zhang et al. (2009) found a decrease in intrinsic absorptions of AGNs with decreasing Eddington ratio, suggesting that the lack of intrinsic absorption (e.g., a dusty torus or an optically thick disk wind) may be directly related to the lack of a standard accretion disk. The absence of an optically thick obscuring structure in LINERs represents further indication that these sources are characterized by a general paucity of gas in their innermost regions with respect to more powerful AGN.
We adopted the threshold of radio to X-rays ratio of 10-4.5 defined by Terashima & Wilson (2003).
References
- Adams, T. F., & Weedman, D. W. 1975, ApJ, 199, 19 [NASA ADS] [CrossRef] [Google Scholar]
- Antonucci, R. 1993, ARA&A, 31, 473 [Google Scholar]
- Asmus, D., Hönig, S. F., Gandhi, P., Smette, A., & Duschl, W. J. 2014, MNRAS, 439, 1648 [NASA ADS] [CrossRef] [Google Scholar]
- Balmaverde, B., & Capetti, A. 2013, A&A, 549, A144 [NASA ADS] [CrossRef] [EDP Sciences] [Google Scholar]
- Balmaverde, B., & Capetti, A. 2014, A&A, 563, A119 [NASA ADS] [CrossRef] [EDP Sciences] [Google Scholar]
- Balmaverde, B., Capetti, A., & Grandi, P. 2006, A&A, 451, 35 [NASA ADS] [CrossRef] [EDP Sciences] [Google Scholar]
- Binette, L., Magris, C. G., Stasińska, G., & Bruzual, A. G. 1994, A&A, 292, 13 [NASA ADS] [Google Scholar]
- Biretta, et al. 2015, in STIS Instrument Handbook, Version 14.0, Baltimore: STScI [Google Scholar]
- Chiaberge, M., Capetti, A., & Celotti, A. 1999, A&A, 349, 77 [NASA ADS] [Google Scholar]
- Constantin, A., & Seth, A. C. 2012, Adv. Astron., 2012, 13 [Google Scholar]
- Czerny, B., Rózańska, A., & Kuraszkiewicz, J. 2004, A&A, 428, 39 [NASA ADS] [CrossRef] [EDP Sciences] [Google Scholar]
- Dudik, R. P., Satyapal, S., Gliozzi, M., & Sambruna, R. M. 2005, ApJ, 620, 113 [NASA ADS] [CrossRef] [Google Scholar]
- Eracleous, M., Shields, J. C., Chartas, G., & Moran, E. C. 2002, ApJ, 565, 108 [NASA ADS] [CrossRef] [Google Scholar]
- Eracleous, M., Hwang, J. A., & Flohic, H. M. L. G. 2010, ApJS, 187, 135 [NASA ADS] [CrossRef] [Google Scholar]
- Filippenko, A. V., & Sargent, W. L. W. 1985, ApJS, 57, 503 [NASA ADS] [CrossRef] [Google Scholar]
- Flohic, H. M. L. G., Eracleous, M., Chartas, G., Shields, J. C., & Moran, E. C. 2006, ApJ, 647, 140 [NASA ADS] [CrossRef] [Google Scholar]
- Gandhi, P., Horst, H., Smette, A., et al. 2009, A&A, 502, 457 [NASA ADS] [CrossRef] [EDP Sciences] [Google Scholar]
- González-Martín, O., Masegosa, J., Márquez, I., Guainazzi, M., & Jiménez-Bailón, E. 2009, A&A, 506, 1107 [NASA ADS] [CrossRef] [EDP Sciences] [Google Scholar]
- Gu, M., & Cao, X. 2009, MNRAS, 399, 349 [NASA ADS] [CrossRef] [Google Scholar]
- Gültekin, K., Cackett, E. M., Miller, J. M., et al. 2012, ApJ, 749, 129 [NASA ADS] [CrossRef] [Google Scholar]
- Heckman, T. M. 1980, A&A, 87, 152 [NASA ADS] [Google Scholar]
- Ho, L. C. 1999, ApJ, 516, 672 [NASA ADS] [CrossRef] [Google Scholar]
- Ho, L. C. 2008, ARA&A, 46, 475 [NASA ADS] [CrossRef] [Google Scholar]
- Ho, L. C., Filippenko, A. V., & Sargent, W. L. 1995, ApJS, 98, 477 [NASA ADS] [CrossRef] [Google Scholar]
- Ho, L. C., Filippenko, A. V., & Sargent, W. L. W. 1997, ApJS, 112, 315 [NASA ADS] [CrossRef] [Google Scholar]
- Ho, L. C., Feigelson, E. D., Townsley, L. K., et al. 2001, ApJ, 549, L51 [NASA ADS] [CrossRef] [Google Scholar]
- Humphrey, A., Villar-Martín, M., Vernet, J., et al. 2008, MNRAS, 383, 11 [NASA ADS] [CrossRef] [Google Scholar]
- Izotov, Y. I., Thuan, T. X., & Guseva, N. G. 2007, ApJ, 671, 1297 [NASA ADS] [CrossRef] [Google Scholar]
- Kewley, L. J., Groves, B., Kauffmann, G., & Heckman, T. 2006, MNRAS, 372, 961 [NASA ADS] [CrossRef] [Google Scholar]
- Krabbe, A., Böker, T., & Maiolino, R. 2001, ApJ, 557, 626 [NASA ADS] [CrossRef] [Google Scholar]
- Loewenstein, M., Mushotzky, R. F., Angelini, L., Arnaud, K. A., & Quataert, E. 2001, ApJ, 555, L21 [NASA ADS] [CrossRef] [Google Scholar]
- Maiolino, R., Salvati, M., Bassani, L., et al. 1998, A&A, 338, 781 [NASA ADS] [Google Scholar]
- Mulchaey, J. S., Koratkar, A., Ward, M. J., et al. 1994, ApJ, 436, 586 [NASA ADS] [CrossRef] [Google Scholar]
- Nagao, T., Murayama, T., Shioya, Y., & Taniguchi, Y. 2002, ApJ, 567, 73 [NASA ADS] [CrossRef] [Google Scholar]
- Nagar, N. M., Falcke, H., & Wilson, A. S. 2005, A&A, 435, 521 [NASA ADS] [CrossRef] [EDP Sciences] [Google Scholar]
- Narayan, R., & Yi, I. 1995, ApJ, 444, 231 [NASA ADS] [CrossRef] [Google Scholar]
- Nemmen, R. S., Storchi-Bergmann, T., & Eracleous, M. 2014, MNRAS, 438, 2804 [NASA ADS] [CrossRef] [Google Scholar]
- Netzer, H., Laor, A., & Gondhalekar, P. M. 1992, MNRAS, 254, 15 [NASA ADS] [CrossRef] [Google Scholar]
- Panessa, F., Bassani, L., Cappi, M., et al. 2006, A&A, 455, 173 [NASA ADS] [CrossRef] [EDP Sciences] [Google Scholar]
- Risaliti, G., Maiolino, R., & Salvati, M. 1999, ApJ, 522, 157 [NASA ADS] [CrossRef] [Google Scholar]
- Singh, R., van de Ven, G., Jahnke, K., et al. 2013, A&A, 558, A43 [NASA ADS] [CrossRef] [EDP Sciences] [Google Scholar]
- Terashima, Y., & Wilson, A. S. 2003, ApJ, 583, 145 [NASA ADS] [CrossRef] [Google Scholar]
- Trinchieri, G., & di Serego Alighieri, S. 1991, AJ, 101, 1647 [NASA ADS] [CrossRef] [Google Scholar]
- Younes, G., Porquet, D., Sabra, B., & Reeves, J. N. 2011, A&A, 530, A149 [NASA ADS] [CrossRef] [EDP Sciences] [Google Scholar]
- Zhang, W. M., Soria, R., Zhang, S. N., Swartz, D. A., & Liu, J. F. 2009, ApJ, 699, 281 [NASA ADS] [CrossRef] [Google Scholar]
All Tables
All Figures
|
Fig. 1 Logarithm of the X-rays luminosity in the 2–10 keV band versus [O III] luminosity (both in erg s-1) measured from ground-based (left) and HST observations (middle), and (right) only for objects with direct [O III] HST measurements. Type 1 LINERs shown with red circles, type 2 objects shown with black circles. The objects for which the [O III] luminosity is derived from the [N II] measurements are marked with smaller green circles. The squares are the RL LINERs. The circles surround objects where LX is corrected for local aborption. In the central and right panel, the solid lines represent the best linear fit. The dashed red line in the central panel is the correlation found for Seyferts by Panessa et al. (2006). |
| In the text | |
|
Fig. 2 Ratio between the HST and ground-based [O III] luminosity vs. the X-rays luminosity. Symbols as in Fig. 1. |
| In the text | |
|
Fig. 3 MIR vs. X-rays luminosities for a subsample of seven LINERs. The solid line is the best linear fit, the dashed red line presents the fit obtained for Seyferts by Gandhi et al. (2009). |
| In the text | |
Current usage metrics show cumulative count of Article Views (full-text article views including HTML views, PDF and ePub downloads, according to the available data) and Abstracts Views on Vision4Press platform.
Data correspond to usage on the plateform after 2015. The current usage metrics is available 48-96 hours after online publication and is updated daily on week days.
Initial download of the metrics may take a while.