Fig. 1
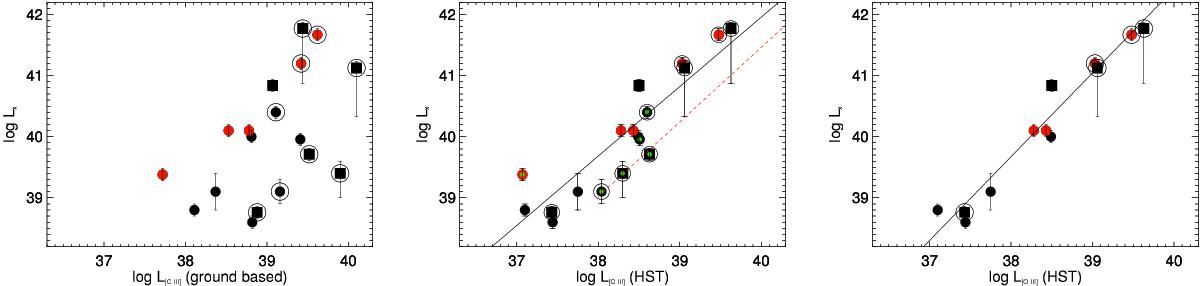
Logarithm of the X-rays luminosity in the 2–10 keV band versus [O III] luminosity (both in erg s-1) measured from ground-based (left) and HST observations (middle), and (right) only for objects with direct [O III] HST measurements. Type 1 LINERs shown with red circles, type 2 objects shown with black circles. The objects for which the [O III] luminosity is derived from the [N II] measurements are marked with smaller green circles. The squares are the RL LINERs. The circles surround objects where LX is corrected for local aborption. In the central and right panel, the solid lines represent the best linear fit. The dashed red line in the central panel is the correlation found for Seyferts by Panessa et al. (2006).
Current usage metrics show cumulative count of Article Views (full-text article views including HTML views, PDF and ePub downloads, according to the available data) and Abstracts Views on Vision4Press platform.
Data correspond to usage on the plateform after 2015. The current usage metrics is available 48-96 hours after online publication and is updated daily on week days.
Initial download of the metrics may take a while.