Fig. 2
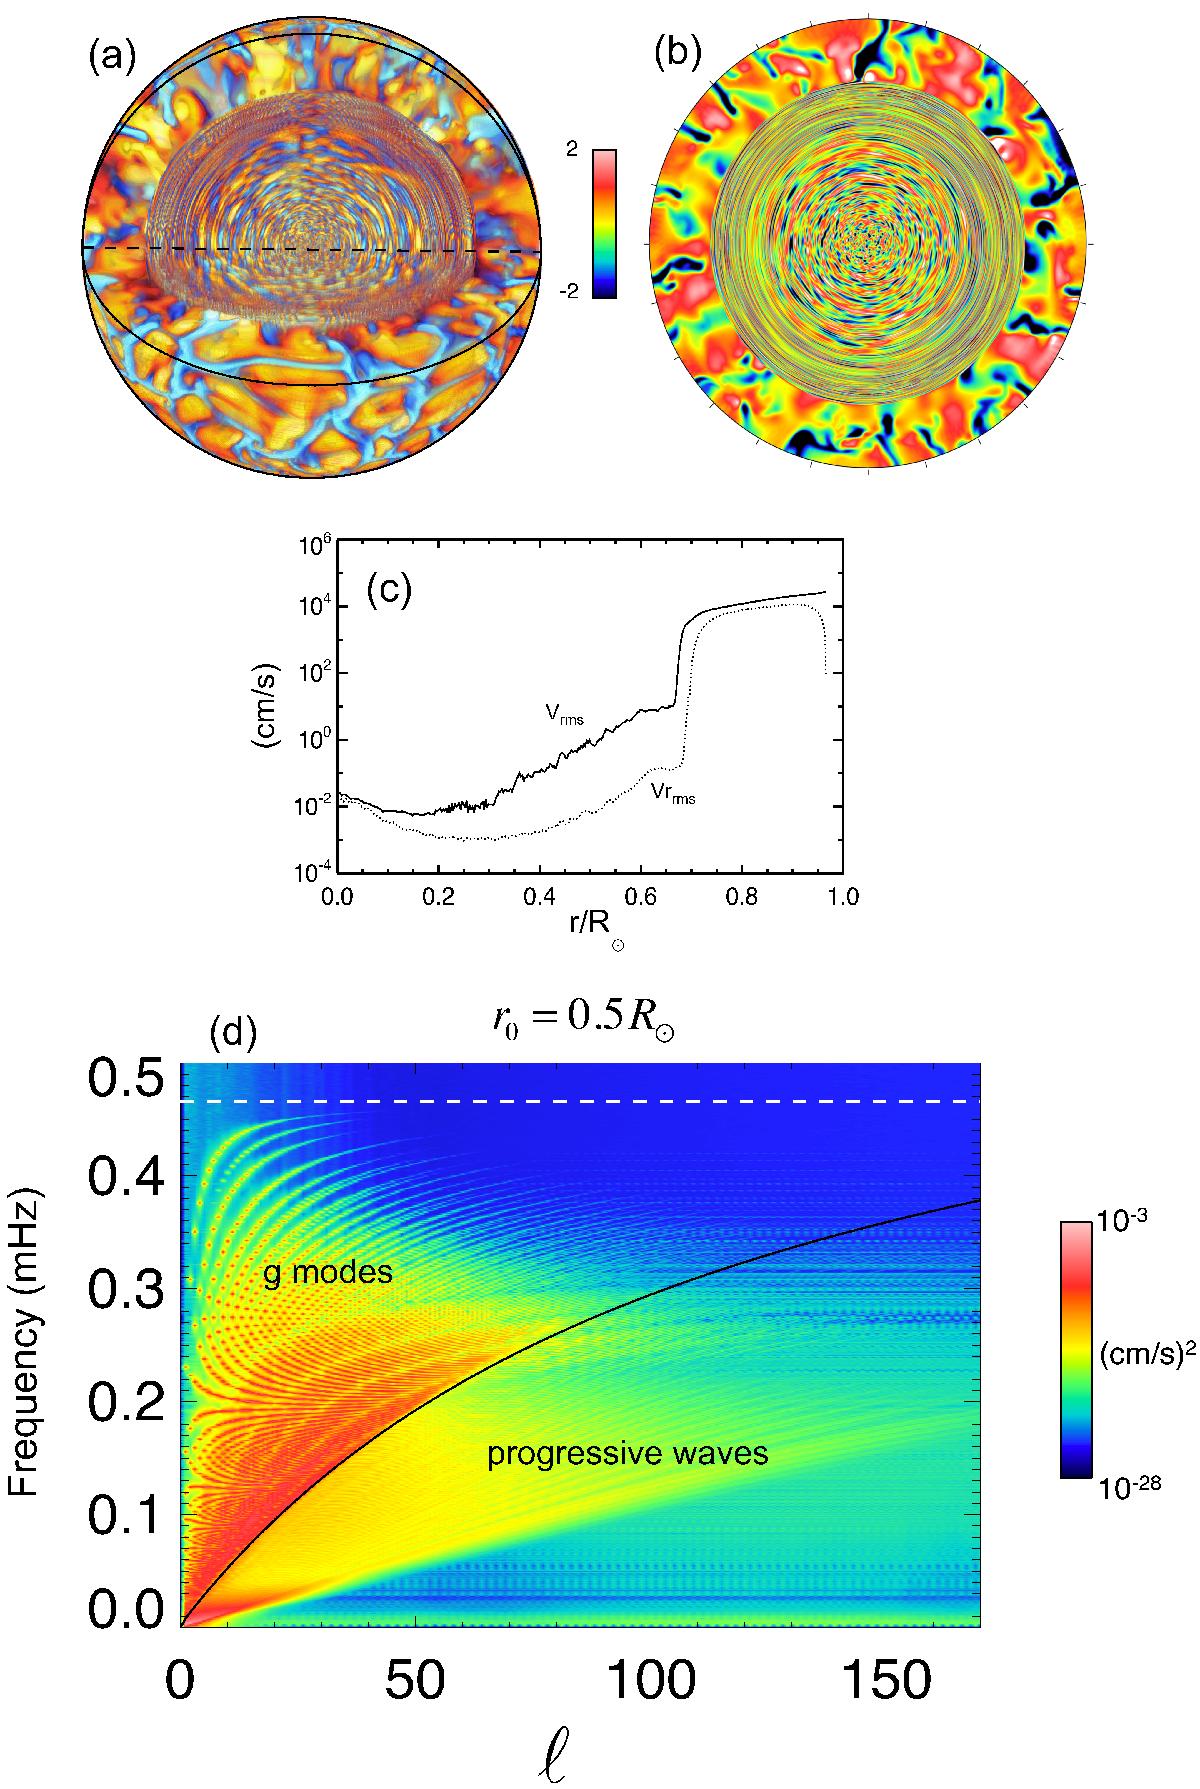
a) 3D rendering of the simulated star. We represent the radial velocity divided by its rms value at each radius. b) Equatorial slice. Like in the 3D view, IGWs pattern are visible in the inner radiative zone as quasi-circular spirals. c) rms profiles of the total (solid line) and radial (dotted line) velocities as a function of the normalized radius, averaged over longitude, latitude, and time (about 10 convective overturning times). d) Energy spectrum of gravity waves computed at r0 = 0.5 R⊙ as a function of degree ℓ and frequency ω. Ridges are formed by g-modes of same radial order n, and we see that they tend to the maximum Brunt-Väisälä frequency at high order ℓ (dotted white line). The black solid line denotes the separation between g-modes (above) and progressive waves (below).
Current usage metrics show cumulative count of Article Views (full-text article views including HTML views, PDF and ePub downloads, according to the available data) and Abstracts Views on Vision4Press platform.
Data correspond to usage on the plateform after 2015. The current usage metrics is available 48-96 hours after online publication and is updated daily on week days.
Initial download of the metrics may take a while.