Fig. 7
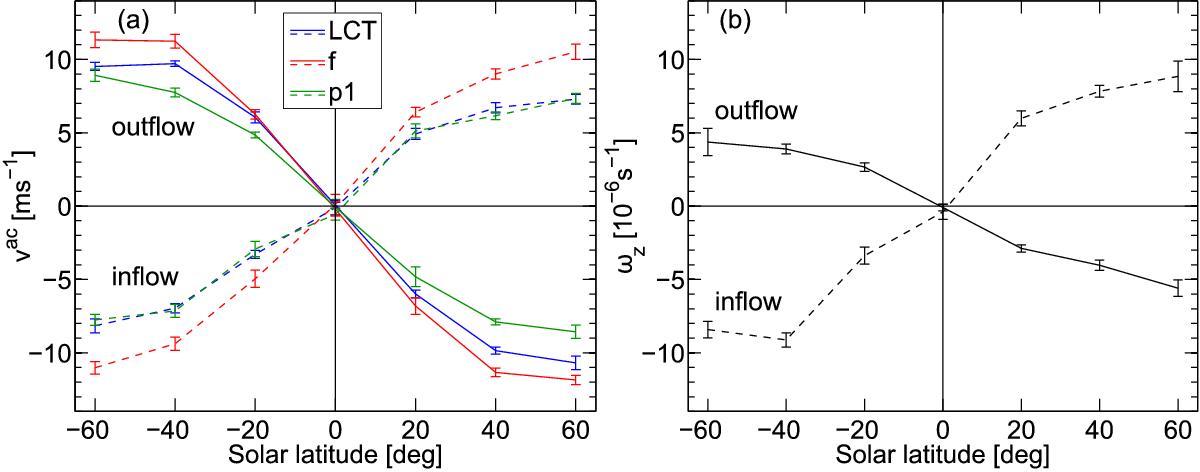
Peak vac and ωz values for the average supergranule at different solar latitudes. a) Circulation velocity vac for LCT, f modes, and p1 modes. b) Vertical component of flow vorticity ωz obtained from LCT. Solid lines are for the average supergranule outflow region, dashed lines for the average supergranule inflow region. At 0° latitude, the values at the map center are shown instead of the peak values. The error bars were computed by dividing the 336 datasets into eight parts and measuring the variance of vac and ωz at the peak positions over the eight parts.
Current usage metrics show cumulative count of Article Views (full-text article views including HTML views, PDF and ePub downloads, according to the available data) and Abstracts Views on Vision4Press platform.
Data correspond to usage on the plateform after 2015. The current usage metrics is available 48-96 hours after online publication and is updated daily on week days.
Initial download of the metrics may take a while.