Fig. 13
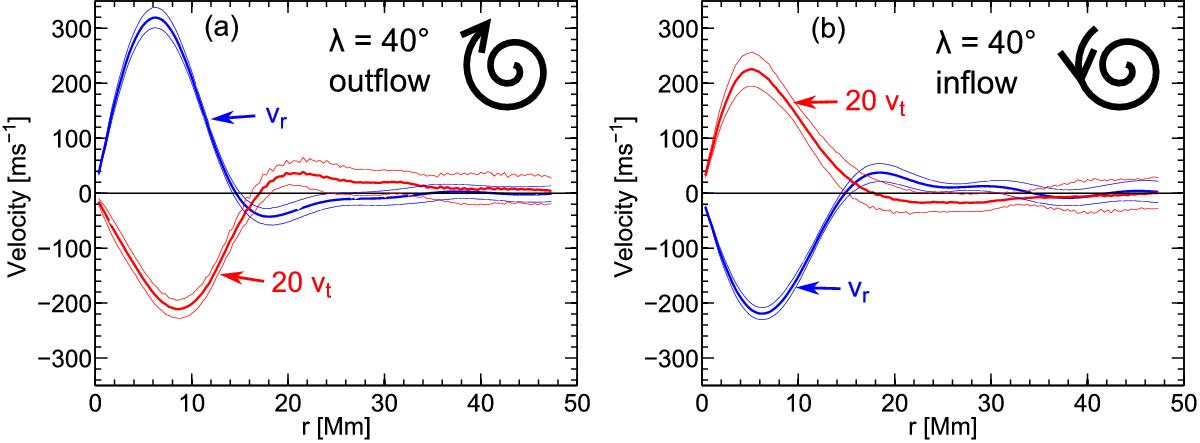
Azimuthally averaged horizontal velocities around the average supergranule outflow and inflow centers at solar latitude 40°. The measurements were obtained from LCT of granules in HMI intensity images. a) Horizontal velocities vr and vt around the average supergranule outflow center. The thin lines mark an estimate of the variability of the data as measured by dividing the 336 datasets into eight parts. For vr, the 10σ level is shown, for vt the 3σ level. b) As a), but around the average supergranule inflow center.
Current usage metrics show cumulative count of Article Views (full-text article views including HTML views, PDF and ePub downloads, according to the available data) and Abstracts Views on Vision4Press platform.
Data correspond to usage on the plateform after 2015. The current usage metrics is available 48-96 hours after online publication and is updated daily on week days.
Initial download of the metrics may take a while.