| Issue |
A&A
Volume 581, September 2015
|
|
|---|---|---|
| Article Number | A32 | |
| Number of page(s) | 5 | |
| Section | Astronomical instrumentation | |
| DOI | https://doi.org/10.1051/0004-6361/201423613 | |
| Published online | 27 August 2015 | |
Research Note
First 230 GHz VLBI fringes on 3C 279 using the APEX Telescope
1 Max Planck Institute for Radio Astronomy (MPIfR), Auf dem Hügel 69, 53121 Bonn, Germany
e-mail: This email address is being protected from spambots. You need JavaScript enabled to view it.
; This email address is being protected from spambots. You need JavaScript enabled to view it.
2 European Southern Observatory, Alonso de Cordova 3107, Casilla 19001, Vitacura, Santiago 19, Chile
3 Atacama Pathfinder Experiment, Parcela #85, Sequitor, San Pedro de Atacama, Chile
4 Department of Earth and Space Sciences, Chalmers University of Technology, Onsala Space Observatory, 439 92 Onsala, Sweden
5 Istituto di Radioastronomia, Istituto Nazionale di Astrofisica, 96017 Noto, Italy
6 MIT Haystack Observatory, Westford, MA 01886, USA
7 Arizona Radio Observatory (ARO), University of Arizona, Tucson, 85721 Arizona, USA
8 Harvard Smithsonian Center for Astrophysics (CfA), Cambridge, MA 02138, USA
9 Institut de Radioastronomie Millimétrique (IRAM), 38400 Saint Martin d’ Hères, France
10 Observatorio del Pico Veleta, Estación RadioAstronómica IRAM-IGN, Granada, Spain
11 SP Technical Research Institute of Sweden, 50115 Borås, Sweden
12 Institute for Astrophysical Research, Boston University, Boston, MA 02215, USA
13 Institute of Geodesy and Geoinformation, University of Bonn, 53113 Bonn, Germany
14 Institute of Astronomy and Astrophysics, Academia Sinica, PO Box 23-141, 10617 Taipei, Taiwan
15 Korea Astronomy and Space Science Institute, 776, Daedeokdae-ro, Yuseong-gu, 305-348 Daejeon, Republic of Korea
e-mail: This email address is being protected from spambots. You need JavaScript enabled to view it.
Received: 10 February 2014
Accepted: 10 June 2015
Abstract
Aims. We report about a 230 GHz very long baseline interferometry (VLBI) fringe finder observation of blazar 3C 279 with the APEX telescope in Chile, the phased submillimeter array (SMA), and the SMT of the Arizona Radio Observatory (ARO).
Methods. We installed VLBI equipment and measured the APEX station position to 1 cm accuracy (1σ). We then observed 3C 279 on 2012 May 7 in a 5 h 230 GHz VLBI track with baseline lengths of 2800 Mλ to 7200 Mλ and a finest fringe spacing of 28.6 μas.
Results. Fringes were detected on all baselines with signal-to-noise ratios of 12 to 55 in 420 s. The correlated flux density on the longest baseline was ~0.3 Jy beam-1, out of a total flux density of 19.8 Jy. Visibility data suggest an emission region ≲ 38 μas in size, and at least two components, possibly polarized. We find a lower limit of the brightness temperature of the inner jet region of about 1010 K. Lastly, we find an upper limit of 20% on the linear polarization fraction at a fringe spacing of ~ 38 μas.
Conclusions. With APEX the angular resolution of 230 GHz VLBI improves to 28.6 μas. This allows one to resolve the last-photon ring around the Galactic Center black hole event horizon, expected to be 40 μas in diameter, and probe radio jet launching at unprecedented resolution, down to a few gravitational radii in galaxies like M 87. To probe the structure in the inner parsecs of 3C 279 in detail, follow-up observations with APEX and five other mm-VLBI stations have been conducted (March 2013) and are being analyzed.
Key words: galaxies: individual: 3C 279 / galaxies: jets / instrumentation: high angular resolution / telescopes
© ESO, 2015
1. Introduction
Very long baseline interferometry (VLBI) at (sub)millimeter wavelengths offers the unique possibility of high angular resolution studies of objects that are self-absorbed or scatter broadenend at longer wavelengths. For the nearby supermassive black holes (SMBH) in Sgr A⋆ and M 87 the angular resolution of global mm-VLBI approaches the diameter of the expected black hole shadow and photon ring size (e.g., Falcke et al. 2000; Ricarte & Dexter 2015).
In this context a joint effort is being undertaken to build a global (sub)mm-VLBI array to image the immediate environment of nearby BHs. The angular resolution and imaging capabilities of this array, called the Event Horizon Telescope1 (EHT; cf. Doeleman et al. 2008, 2009), can be improved by adding more stations and longer baselines. As a part of such efforts we carried out a pilot mm-VLBI experiment with the 12 m APEX telescope2 situated near the ALMA array at Chajnantor, Chile. This pilot experiment could be regarded as a pathfinder for the planned participation of ALMA in mm-VLBI.
Two initial attempts at adding a southern mm-VLBI station did not produce fringes (ASTE in 2010 by Honma et al. (NAOJ), APEX in 2011). After improvements at APEX in 2012 (for technical details, see Roy et al. 2013), we detected the first 230 GHz fringes at extremely long baselines of 7170 km to 9450 km with the currently highest angular resolution of 28.6 μas. This continuation of earlier efforts (e.g., Krichbaum et al. 2004, 2008) enables global 1.3 mm-VLBI at an angular resolution sufficient to resolve event horizon scale emission in Sgr A⋆ and M 87. These and several other sources will be observed over the next years.
2. Blazar 3C 279
The blazar 3C 279 is one of the brightest and best monitored flat-spectrum quasars and was the first object to exhibit apparent superluminal motion. The source of its strong radio to γ-ray emission is a relativistic jet of material ejected from near the black hole in 3C 279. The southwest oriented large-scale jet has been extensively studied with ≤86 GHz VLBI. Adopting the black hole mass of Nilsson et al. (2009), the redshift of Marziani et al. (1996), and ΛCDM cosmology of Hinshaw et al. (2013), the scale on 3C 279 is 1.0 μas ≅ 0.0064 pc ≅ 130 Rs.
As one of the brightest quasars 3C 279 is suitable for VLBI fringe finding, although its structure is partially resolved at mm wavelengths. An observation at 147 GHz finds a single 34 μas component (but is limited by uv coverage; cf. Krichbaum et al. 2002), whereas 43 GHz VLBI data from the VLBA-BU-BLAZAR project (Jorstad et al. 2011) suggest three components in the inner 1 mas. Similarly, in a 230 GHz EHT observation in 2011 one to two components are seen offset from the core by 80−145 μas (Lu et al. 2013).
3. APEX station position
A high-precision APEX station position is required to minimize the residual fringe rate that causes coherence loss during time integration in the VLBI correlator. Maintaining better than 90% coherence in 1 s requires the residual fringe rate to be <0.25 Hz. At 345 GHz this corresponds to a position error of <3 m.
We derived an initial low-accuracy position (3 m rms) using a single-band TrueTime XL-AK GPS timing receiver mounted on the telescope, and data logged in 2010 over a one-month period. For better accuracy Onsala later supplied a dual-band Ashtech Micro-Z GPS receiver and TIGO in Concepción lent a choke-ring antenna. We logged dual-band GPS data of the telescope azimuth track over several days in March 2011. Kinematic position solutions were derived to determine the circle center, giving the position of the azimuth axis with 0.3 mm accuracy. These were adjusted upward by 46 ± 0.5 cm, which is the altitude difference between the reference plane of the GPS antenna and the telescope elevation axis.
The final single- and dual-band GPS station positions agreed to 20 cm, well within their error bounds. The resulting position of the axis intersection, accurate to 1 cm (1σ), is provided below as Geodetic and X, Y, Z coordinates in the ITRF2005 system:

4. Observation
We observed 3C 279 in a three-station 230 GHz (1.3 mm) VLBI session on 2012 May 7 from UT 02:00 to 06:52 during good mm-VLBI weather. The three stations were: 1) the 12 m APEX telescope jointly operated by the MPIfR, ESO and OSO on the Chajnantor plateau in Atacama, Chile (see Güsten et al. 2006), close to the ALMA array; 2) the Arizona Radio Observatory (ARO) -operated 10 m Heinrich Hertz Sub-millimeter Telescope (ARO SMT) on Mount Graham, Arizona; and 3) the Submillimeter Array (SMA; CfA and ASIAA) on Mauna Kea, Hawaii, with eight 6 m dishes phased. The SMA joined the observation at UT 03:15. The observation sampled a 512 MHz bandwidth (480 MHz usable) in lower sideband at 229.33 GHz using DBE1 polyphase filterbank backends (cf. Digital Backend Memo Series, MIT Haystack). At APEX a second backend was installed, the DBBC (Tuccari et al. 2012). Data were recorded at 2 Gbit/s on Mark 5 recorders.
The three VLBI baselines (Table 1) sampled uv radii of 2800 Mλ to 7200 Mλ. The shortest fringe spacing was 28.6 μas. The uv coverage on 3C 279 is shown in Fig. 1.
Baseline resolution and attained sensitivity.
 |
Fig. 1 UV coverage on 3C 279 on 2012 May 7 UT 02:00-07:00. |
4.1. Polarization
The ARO SMT recorded both circular polarizations. At APEX we used the 230 GHz single-polarization APEX-1 SHeFI receiver (see Belitsky et al. 2007; Vassilev et al. 2008) and inserted a λ/4 plate into the optical path to convert linear into circular polarization. The native APEX handedness after 9 mirror reflections (Wieching 2010, priv. comm.) was LCP (“L”). To maximize experiment output, we switched APEX to RCP (“R”) at UT 04:30 by reorienting the λ/4 plate. Lastly, the SMA unintentionally observed in a single linear polarization (“X”), thus complicating the interpretation of the resultant visibilities.
4.2. Receiver coherence at APEX
We monitored the APEX receiver coherence by injecting an H-maser -locked 229 GHz pilot tone (PCal) into the SHeFI receiver optics via a horn antenna. The PCal system increased the system temperature negligibly and did not change the nominal APEX sensitivity. The PCal tone phase was measured in 2012, 2013, and again in 2015 with a better tone synthesizer. The receiver coherence (>95% in 1 s) met the requirements for mm-VLBI.
5. Data reduction
The station recordings were correlated at the MPIfR Bonn in the DiFX software correlator (Deller et al. 2011). We fringe fitted and reduced the visibility data in NRAO AIPS using standard methods. As a cross-check we also reduced the data in the Haystack Observatory Postprocessing System3 for mm-VLBI (HOPS; cf. Lonsdale & Doeleman 1998), with consistent results.
Calibrations included antenna system temperature data, and a gain calibration on the Moon and Saturn, with a gain estimate used for the phased SMA. Water vapor radiometer and sky dip data were used to correct for atmospheric opacity at a slow cadence. These a priori calibration data are summarized in Table 2. The amplitude loss due to the SMA linear polarization was compensated by a constant gain of  . We further corrected for DBE1 phase offsets. The optimal fringe fitting interval was 20 s, twice the shortest coherence time on APEX baselines.
Station amplitude calibration data.
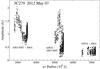 |
Fig. 2 Visibility amplitude (Jy) against uv distance (Mλ), averaged using an integration time per point of 10 s. |
 |
Fig. 3 Visibility amplitudes (Jy) against time, averaged to 10 s per point. The vertical line indicates the polarization swap on the APEX−SMT (LL to RR) and other baselines (LX to RX). |
6. Results and discussion
Strong fringes were detected on all VLBI baselines. The visibility amplitudes are shown against uv distance in Fig. 2, and against time in Fig. 3. The phased SMA measured a flux density of 19.8 Jy, agreeing well with the nearest data (2012 April 27, May 11) of their monitoring program (Gurwell et al. 2007). The backends at APEX yielded zero baseline correlation coefficients of > 0.95, demonstrating the DBBC to be ready for mm-VLBI.
The APEX−SMA and ARO SMT−SMA baselines produced mixed-hand fringes (LX, RX) with signal-to-noise ratios (S/Ns) reported by the HOPS fringe fitter of between 12 and 35 in 420 s on the former baseline, and S/Ns of up to 55 on the latter. The APEX−ARO SMT baseline produced parallel hand fringes (LL, RR) with S/Ns between 12 and 35 in 420 s. No fringes were detected in the cross-hands (LR, RL). Assuming a detection threshold S/N of 6, this sets an upper limit of 20% on the linear polarization fraction of 3C 279 fine-scale structure. This appears consistent with the nearest VBLA-BU-BLAZAR 43 GHz maps (2012 April 28, May 26) that show polarization degrees between 1% and 14% for three components detected in the inner 1 mas of 3C 279 (Jorstad, priv. comm.). For other 43 GHz images, see the VLBA-BU-BLAZAR web page or Jorstad et al. (in prep.).
The mixed-polarization “closure phase” on the APEX−ARO SMT−SMA triangle (LLX, RRX) is shown in Fig. 4. The closure phase signature of a single source component is zero at all polarization fractions, independent of antenna polarization hands. The detection was not consistent with this signature. This implies two or more components, possibly polarized. Continuity in “closure phase” and visibility amplitudes across the APEX polarization swap (Figs. 3, 4) further suggests that any polarized sub-structure is only weakly polarized or almost point-like.
Model fitting to constrain the sub-structure is complicated by the mixed polarization setup. It may have corrupted visibilities on SMA baselines and source structure phase in the observed “closure phase”. These data contain the desired co-polar signal with well studied contaminants (e.g., Massi et al. 1996), as well as cross-polar contamination that is non-trivially dependent on instrumentation and polarized source structure. We simulated models of plausible 3C 279 fine-scale structure with different degrees of component polarization using AIPS task DTSIM, modified to generate mixed polarization visibilities. The closure phase corruption was found to be mostly small relative to the trend in Fig. 4. In contrast, the amplitudes on SMA baselines were impacted by larger polarization-dependent offsets and some parallactic angle-dependent variation. Robustly untangling source structure and contaminations in the observed mixed-polarization data proved challenging.
 |
Fig. 4 Mixed polarization “closure phase” with 1σ uncertainties, averaged to 420 s per point. The vertical line indicates the time of polarization change from LLX to RRX. |
 |
Fig. 5 Lower limits of the inner jet brightness temperature based on visibilities before (diamonds), after (crosses), or across (solid) the APEX polarization switch, with 1σ uncertainties. |
The APEX−ARO SMT visibilities (LL, RR) are unaffected by the SMA polarization. We thus follow a common approach used for sparse visibility data to derive a lower limit of the brightness temperature, Tb, of the inner jet region, based on visibility amplitudes, S(q), against uv distance, q (see, e.g., Lobanov 2015). Two assumptions are necessary. Firstly, that visibility amplitudes are dominated by the radio core, and secondly, that the resolved structure is sufficiently well described by a circular Gaussian component (Tb = [2ln2/(πkB)] Sλ2/θ2), with a full width at half maximum size, θ. A fringe detection implies that θ is smaller than the respective fringe spacing, i.e., θ ≤ 1 /q.
The resultant lower limit of Tb of the inner jet region is about 1010 K. It is shown against uv distance in Fig. 5, with “lower limits” on SMA baselines shown for reference. Lastly, we note that estimating the Tb of the core, and identifying other inner jet -related fine-scale structure, requires future quasi-simultaneous VLBI imaging observations at 1.3 mm and longer wavelengths.
7. Conclusions
The first APEX 1.3 mm VLBI fringes with a longest baseline of 7200 Mλ and a shortest fringe spacing of 28.6 μas demonstrated that new mm-VLBI observations can now be carried out with an improved angular resolution. For Sgr A⋆ and M 87 in particular a sufficiently high resolution can now be reached to directly probe the accretion physics and strong relativistic effects at event horizon scales. The current 3C 279 mixed-polarization data at this unprecedented high resolution showed hints of fine-scale structure, but did not allow a detailed study. New 1.3 mm VLBI observations that include 3C 279 have been made (March 2013) with the largest array yet available at this frequency, now six stations including APEX. These new data are being analyzed.
This publication is based on data acquired with the Atacama Pathfinder Experiment (APEX). APEX is a collaboration between the Max-Planck-Institut für Radioastronomie, the European Southern Observatory, and the Onsala Space Observatory.
Acknowledgments
We thank Hayo Hase (BKG/TIGO) for his prompt support with the loan of a replacement GPS antenna that enabled us to measure the station position. We thank Lars-Åke Nyman for arranging the FTP transfer of test data from the ALMA OSF, and for finding the historical GPS installation of Gradinarsky et al. (2001) at the ALMA site. We thank Svetlana Jorstad for her input on polarization. We also thank all people at the telescopes, institutes, and companies for their indispensable help and support that made APEX mm-VLBI possible. This study makes use of 43 GHz VLBA data from the Boston University gamma-ray blazar monitoring program VLBA-BU-BLAZAR (http://www.bu.edu/blazars/VLBAproject.html), funded by NASA through the Fermi Guest Investigator Program. VLBI research at the Sub-millimeter Telescope of the Arizona Radio Observatory is partially supported by the NSF University Radio Observatories Program (URO grant AST-1140030) and by AST-0905844. The ARO is a facility of Steward Observatory, University of Arizona. Facilities: APEX, SMA, ARO SMT.
References
- Belitsky, V., Lapkin, I., Vassilev, V., et al. 2007, in Infrared and Millimeter Waves, 2007 and the 2007 15th Int. Conf. on Terahertz Electronics, IRMMW-THz, Joint 32nd Int. Conf., 326 [Google Scholar]
- Deller, A. T., Brisken, W. F., Phillips, C. J., et al. 2011, PASP, 123, 275 [NASA ADS] [CrossRef] [Google Scholar]
- Doeleman, S. S., Weintroub, J., Rogers, A. E. E., et al. 2008, Nature, 455, 78 [NASA ADS] [CrossRef] [PubMed] [Google Scholar]
- Doeleman, S., Agol, E., Backer, D., et al. 2009, in Astro2010: The Astronomy and Astrophysics Decadal Survey, 68 [Google Scholar]
- Falcke, H., Melia, F., & Agol, E. 2000, ApJ, 528, L13 [NASA ADS] [CrossRef] [PubMed] [Google Scholar]
- Gradinarsky, L. P., Johansson, J. M., Elgered, G., & Jarlemark, P. 2001, Physics and Chemistry of the Earth A, 26, 421 [NASA ADS] [CrossRef] [Google Scholar]
- Gurwell, M. A., Peck, A. B., Hostler, S. R., Darrah, M. R., & Katz, C. A. 2007, From Z-Machines to ALMA: (Sub)Millimeter Spectroscopy of Galaxies, eds. A. J. Baker, J. Glenn, A. I. Harris, J. G. Mangum, & M. S. Yun, ASP. Conf. Ser., 375, 234 [Google Scholar]
- Güsten, R., Nyman, L. Å., Schilke, P., et al. 2006, A&A, 454, L13 [NASA ADS] [CrossRef] [EDP Sciences] [Google Scholar]
- Hinshaw, G., Larson, D., Komatsu, E., et al. 2013, ApJS, 208, 19 [NASA ADS] [CrossRef] [Google Scholar]
- Jorstad, S., Marscher, A., Agudo, I., & Harrison, B. 2011, Fermi Symp. Proc. − eConf C110509 [arXiv:1111.0110] [Google Scholar]
- Krichbaum, T. P., Graham, D. A., Alef, W., et al. 2002, in Proc. 6th EVN Symp., eds. E. Ros, R. W. Porcas, A. P. Lobanov, & J. A. Zensus, 125 [Google Scholar]
- Krichbaum, T. P., Graham, D. A., Alef, W., et al. 2004, in European VLBI Network on New Developments in VLBI Science and Technology, eds. R. Bachiller, F. Colomer, J.-F. Desmurs, & P. de Vicente, 15 [Google Scholar]
- Krichbaum, T. P., Bach, U., Graham, D. A., et al. 2008, in Proc. 9th Europ. VLBI Network Symp. on The role of VLBI in the Golden Age for Radio Astronomy, September 23−26, 2008, Bologna, Italy, PoS(IX EVN Symposium)001 [Google Scholar]
- Lobanov, A. 2015, A&A, 574, A84 [NASA ADS] [CrossRef] [EDP Sciences] [Google Scholar]
- Lonsdale, C. J., & Doeleman, S. S. 1998, in Radio Emission from Galactic and Extragalactic Compact Sources, eds. J. A. Zensus, G. B. Taylor, & J. M. Wrobel, IAU Colloq. 164, ASP. Conf. Ser., 144, 407 [Google Scholar]
- Lu, R.-S., Fish, V. L., Akiyama, K., et al. 2013, ApJ, 772, 13 [NASA ADS] [CrossRef] [Google Scholar]
- Marziani, P., Sulentic, J. W., Dultzin-Hacyan, D., Calvani, M., & Moles, M. 1996, ApJS, 104, 37 [Google Scholar]
- Massi, M., Comoretto, G., Rioja, M., & Tofani, G. 1996, A&AS, 116, 167 [NASA ADS] [Google Scholar]
- Nilsson, K., Pursimo, T., Villforth, C., Lindfors, E., & Takalo, L. O. 2009, A&A, 505, 601 [NASA ADS] [CrossRef] [EDP Sciences] [Google Scholar]
- Ricarte, A., & Dexter, J. 2015, MNRAS, 446, 1973 [NASA ADS] [CrossRef] [Google Scholar]
- Roy, A. L., Wagner, J., Wunderlich, M., et al. 2013, in Proc. 11th EVN Symp. 2012, October 9−12, 2012, Bordeaux, France, PoS(11th EVN Symposium)057 [Google Scholar]
- Tuccari, G., Comoretto, G., Melis, A., & Buttaccio, S. 2012, in Millimeter, Submillimeter, and Far-Infrared Detectors and Instrumentation for Astronomy VI, ed. W. S. Holland, Amsterdam, Proc. SPIE 8452, 2W [Google Scholar]
- Vassilev, V., Meledin, D., Lapkin, I., et al. 2008, A&A, 490, 1157 [NASA ADS] [CrossRef] [EDP Sciences] [Google Scholar]
All Tables
All Figures
|
Fig. 1 UV coverage on 3C 279 on 2012 May 7 UT 02:00-07:00. |
| In the text | |
|
Fig. 2 Visibility amplitude (Jy) against uv distance (Mλ), averaged using an integration time per point of 10 s. |
| In the text | |
|
Fig. 3 Visibility amplitudes (Jy) against time, averaged to 10 s per point. The vertical line indicates the polarization swap on the APEX−SMT (LL to RR) and other baselines (LX to RX). |
| In the text | |
|
Fig. 4 Mixed polarization “closure phase” with 1σ uncertainties, averaged to 420 s per point. The vertical line indicates the time of polarization change from LLX to RRX. |
| In the text | |
|
Fig. 5 Lower limits of the inner jet brightness temperature based on visibilities before (diamonds), after (crosses), or across (solid) the APEX polarization switch, with 1σ uncertainties. |
| In the text | |
Current usage metrics show cumulative count of Article Views (full-text article views including HTML views, PDF and ePub downloads, according to the available data) and Abstracts Views on Vision4Press platform.
Data correspond to usage on the plateform after 2015. The current usage metrics is available 48-96 hours after online publication and is updated daily on week days.
Initial download of the metrics may take a while.