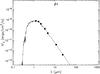
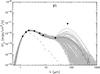
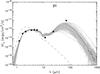
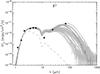
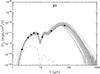
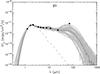
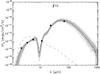
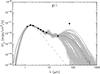
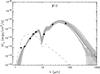
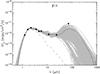
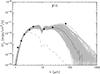
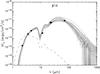
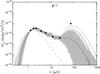
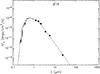
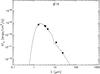
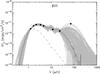
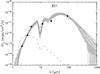
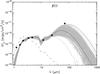
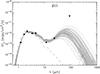
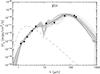
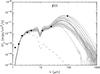
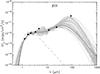
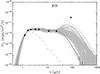
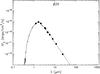
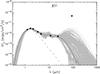
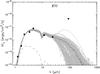
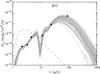
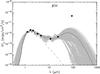
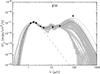
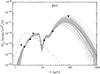
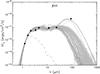
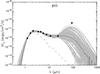
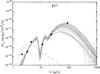
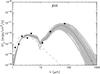
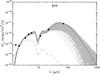
Fig. 9
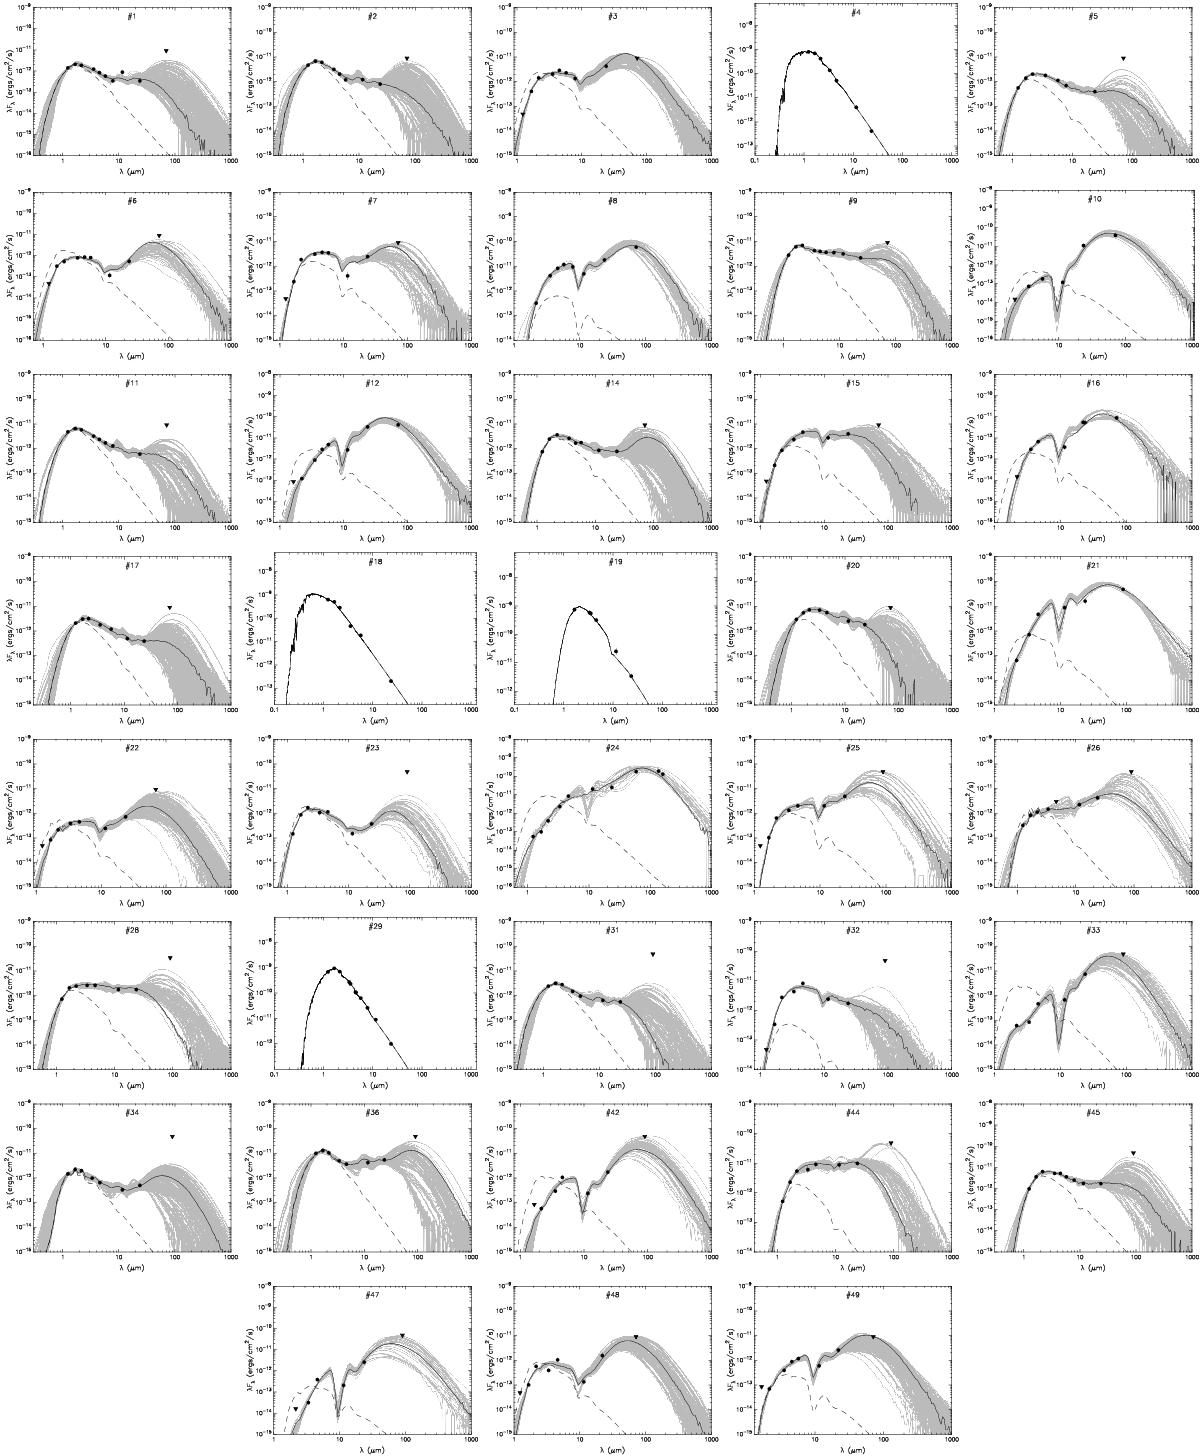
SEDs of the YSOs discussed in the text. The black line shows the best fit model,
and the grey lines show subsequent models that satisfy
![]() criteria. The dashed line shows the stellar photosphere corresponding to the central
source of the best fitting model. The circles denote the observed flux values. The
IDs correspond to the source given in Table 2.
criteria. The dashed line shows the stellar photosphere corresponding to the central
source of the best fitting model. The circles denote the observed flux values. The
IDs correspond to the source given in Table 2.
Current usage metrics show cumulative count of Article Views (full-text article views including HTML views, PDF and ePub downloads, according to the available data) and Abstracts Views on Vision4Press platform.
Data correspond to usage on the plateform after 2015. The current usage metrics is available 48-96 hours after online publication and is updated daily on week days.
Initial download of the metrics may take a while.