Free Access
Fig. 7
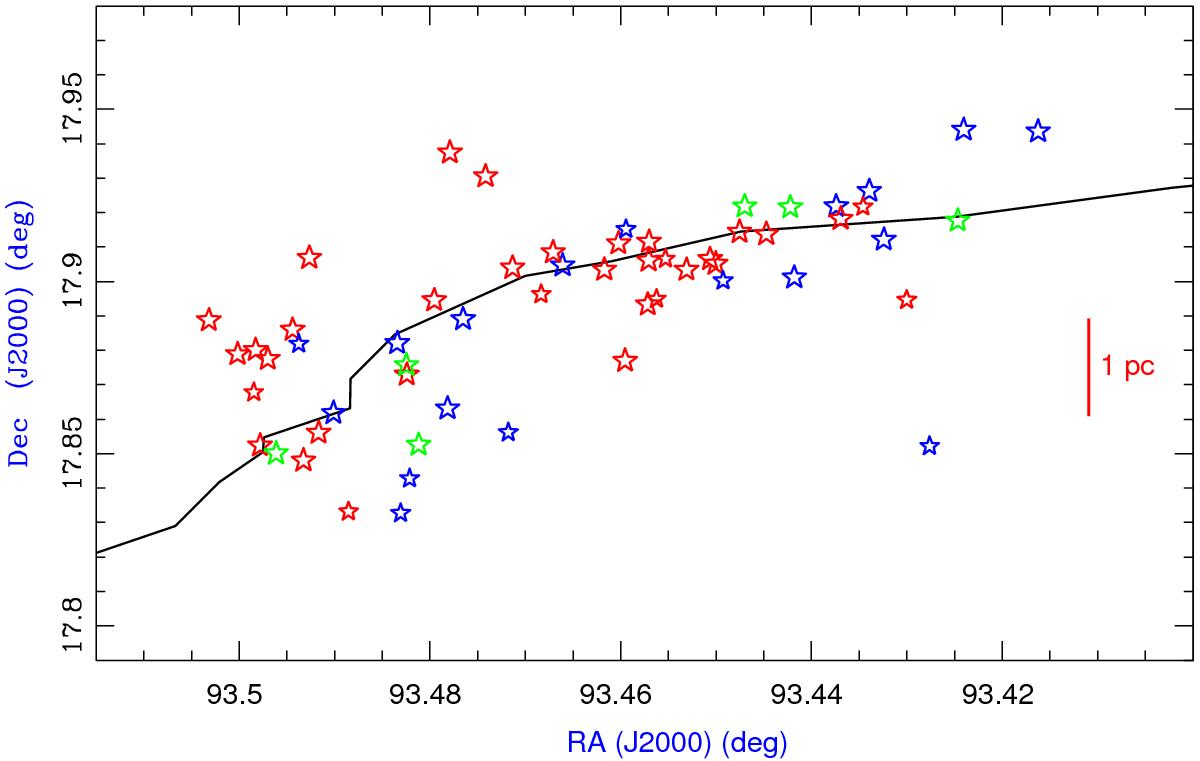
Spatial distribution of Class I (red stars), flat-spectrum-spectrum (green stars), and Class II (blue stars) YSOs. The continuous line running from south-east to north-west marks the highest H2 column density line of the filament along its long axis.
Current usage metrics show cumulative count of Article Views (full-text article views including HTML views, PDF and ePub downloads, according to the available data) and Abstracts Views on Vision4Press platform.
Data correspond to usage on the plateform after 2015. The current usage metrics is available 48-96 hours after online publication and is updated daily on week days.
Initial download of the metrics may take a while.