Fig. 3
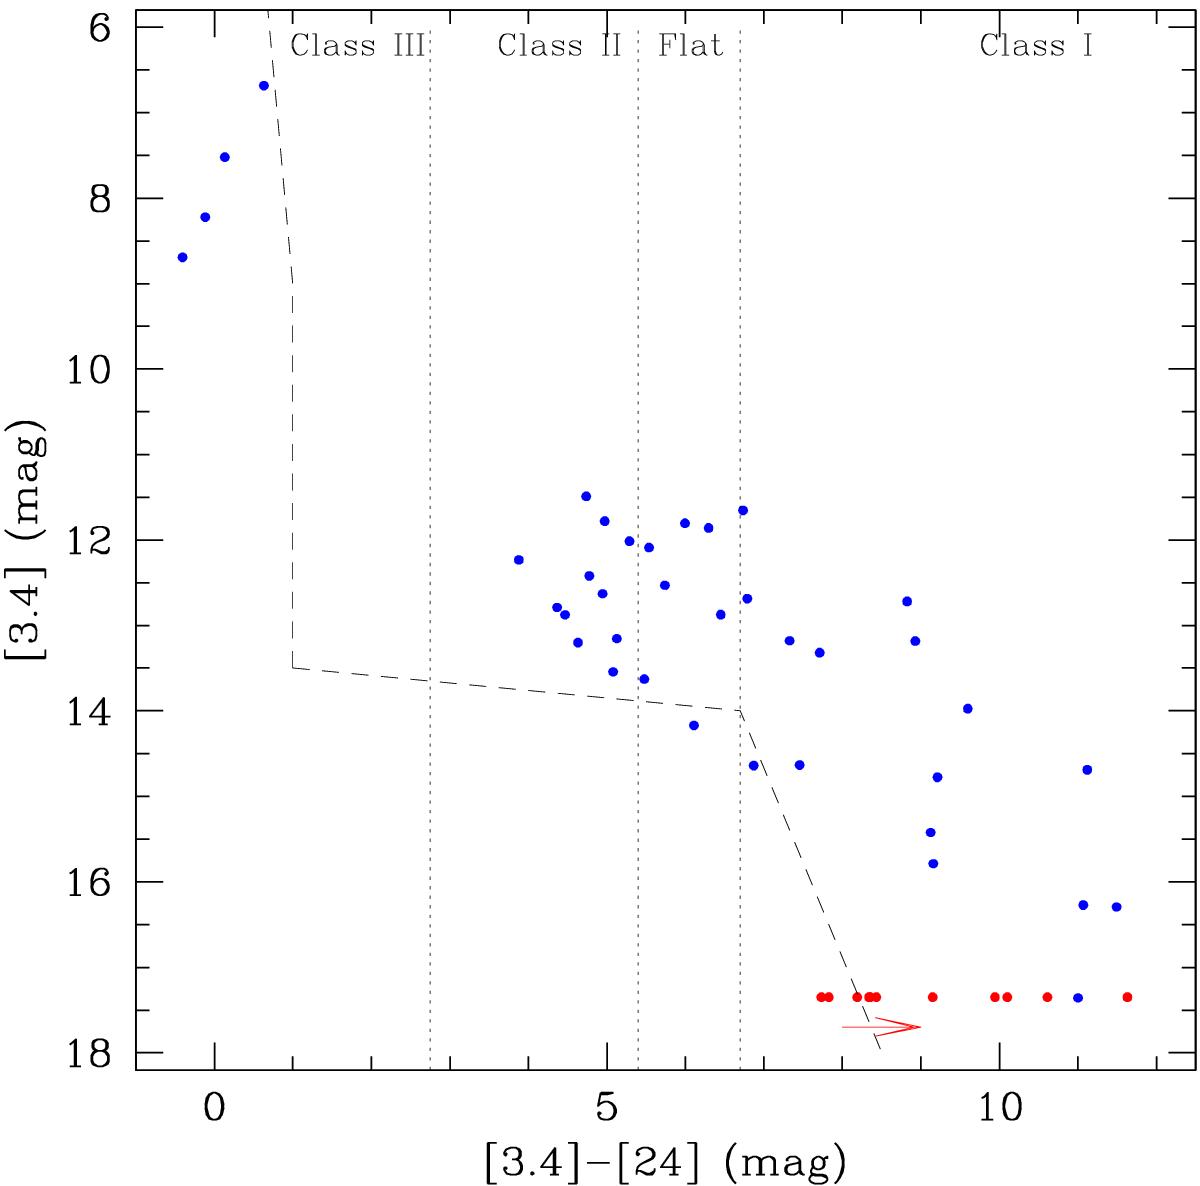
[3.4]−[24] vs. [3.4] colour-magnitude diagram for the detected MIPS 24 μm sources. The dotted lines separate the regions of Class I, flat-spectrum, Class II, and Class III objects. The dashed lines denote the dividing line between the region occupied by contaminated sources (galaxies and diskless stars) and YSOs (see also Rebull et al. 2011). The sources for which we do not have WISE 3.4 μm detection are represented in red. For these sources, we consider the magnitude of the faintest 3.4 μm counterpart of our 24 μm detections as an upper-limit. The arrow represents the direction of their colours, they are likely to be Class I YSOs.
Current usage metrics show cumulative count of Article Views (full-text article views including HTML views, PDF and ePub downloads, according to the available data) and Abstracts Views on Vision4Press platform.
Data correspond to usage on the plateform after 2015. The current usage metrics is available 48-96 hours after online publication and is updated daily on week days.
Initial download of the metrics may take a while.