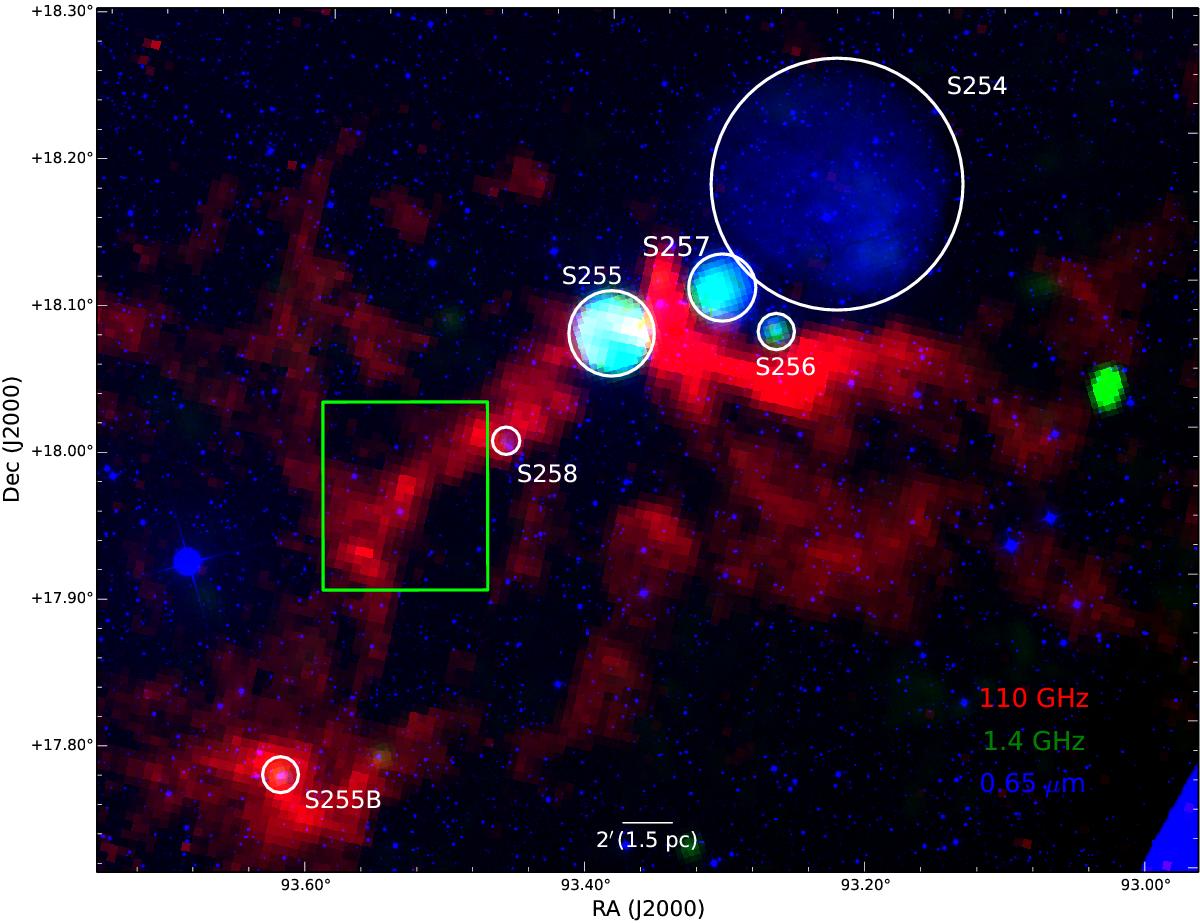
Fig. 1

Colour composite image of the complex obtained using the 13CO (110 GHz) column density map in red (from Chavarría et al. 2008), radio emission in green (from NVSS survey at 1.4 GHz; Condon et al. 1998) and optical emission in blue (from DSS2 survey). The abscissa (RA) and ordinate (Dec) are in the J2000 epoch. North is up and east is left. The H ii regions discussed in the text are marked in white circles. The rectangular box represents the area studied in this work (the corresponding image at 24 μm is shown in Fig. 2).
Current usage metrics show cumulative count of Article Views (full-text article views including HTML views, PDF and ePub downloads, according to the available data) and Abstracts Views on Vision4Press platform.
Data correspond to usage on the plateform after 2015. The current usage metrics is available 48-96 hours after online publication and is updated daily on week days.
Initial download of the metrics may take a while.


