| Issue |
A&A
Volume 580, August 2015
|
|
|---|---|---|
| Article Number | A78 | |
| Number of page(s) | 3 | |
| Section | Catalogs and data | |
| DOI | https://doi.org/10.1051/0004-6361/201526828 | |
| Published online | 06 August 2015 | |
Research Note
Principal component analysis-based inversion of effective temperatures for late-type stars⋆
1
Université de Toulouse, UPS-Observatoire Midi-Pyrénées, Irap,
31028
Toulouse Cedex 4
France
e-mail:
This email address is being protected from spambots. You need JavaScript enabled to view it.
2
CNRS, Institut de Recherche en Astrophysique et
Planétologie, 14 Av. E.
Belin, 31400
Toulouse,
France
3
Department of Physics and Astronomy, Notre Dame
University-Louaize, PO Box
72, Zouk Mikaël,
Lebanon
4 Armagh Observatory, College Hill, BT61 9DG Armagh, Northern
Ireland
Received: 24 June 2015
Accepted: 14 July 2015
Abstract
We show how the range of application of the principal component analysis-based inversion method of Paletou et al. (2015, A&A, 573, A67) can be extended to data for late-type stars. Besides being an extension of its original application domain, which applied to FGK stars, we also used synthetic spectra for our learning database. We discuss our results for effective temperatures in comparison with previous evaluations made available from VizieR and Simbad services at CDS.
Key words: virtual observatory tools / stars: fundamental parameters / stars: late-type
Based on data obtained from the ESO Science Archive Facility.
© ESO, 2015
1. Introduction
Effective temperatures of late-type stars were inverted from HARPS spectra, using the principal component analysis-based (PCA) method detailed in Paletou et al. (2015). In the latter study, fundamental parameters of FGK stars were inverted using a so-called learning database generated from the Elodie stellar spectra library (see Prugniel et al. 2007) using observed spectra for which fundamental parameters were already evaluated. Also, spectra considered in the Paletou et al. (2015) study had typical spectral resolution ℛ of 50 000 (Allende Prieto el al. 2004) and 65 000 (Petit et al. 2014), i.e. values significantly lower than HARPS data.
In this study, the inversion of the effective temperature, Teff, from spectra of late-type (dwarf) stars of K and M spectral types is performed using a database of synthetic spectra. We discuss hereafter comparisons with published values collected from the VizieR and Simbad services of CDS.
2. The learning database
A grid of 6336 spectra was computed using Synspec-48 synthetic spectra code (Hubeny & Lanz 1992) and Kurucz Atlas-12 model atmospheres (Kurucz 2005). The linelist was built from Kurucz (1992) gfhyperall.dat1.
For our purposes, we adopted a grid of parameters such that Teff is in a 3500–4600 K range with a 100 K step, log g is in the range of 4–5 dex with a 0.2 dex step, metallicity [Fe/H] is in a −2–+0.5 range with a 0.25 dex step and, finally, v sin i varies from 0 to 14 km s-1 with a 2 km s-1 step.
For all models, the microturbulent velocity was fixed at ξt = 1 km s-1 and [α/Fe] was set to 0. The spectral resolution of the HARPS spectrograph, i.e. ℛ = 115 000 was adopted for the production of this set of synthetic spectra. We finally limited the study to a spectral band centred around the Na i D-doublet, ranging from 585.3 to 593.2 nm.
Even though the choice of Atlas for such cool stars as well as the choice of the spectral bands we considered may be questionable, we show that effective temperatures we inverted from HARPS data are realistic enough for several further studies (e.g. rotation-activity correlations vs. the spectral type).
3. Observational and reference data
We used 57 high-resolution HARPS spectra taken from the ESO Science Archive Facility. The selection targeted late-type dwarf K stars, and early-type dwarf M stars. We also gave preference to high signal-to-noise spectra. Related objects are listed in Fig. 1; see also Table 1.
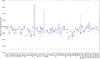 |
Fig. 1 Comparison between our estimate of effective temperatures (•), and the values we got from available VizieR catalogues. The latter collections are represented as classical boxplots. (The horizontal bar inside each box indicates the median, or Q2 value, while each box extends from first quartile, Q1, to third quartile Q3. Extreme values, still within a 1.5 times the interquartile range away from either Q1 or Q3, are connected to the box with dashed lines. Outliers are denoted by a “+” symbol.) Objects we studied are listed along the horizontal axis. In addition, for each object at level Teff ~ 2800 K, we explicated the number of values found among all VizieR catalogues. |
All reference data were collected from VizieR catalogues, using the Astroquery2 Python modules already mentioned by Paletou & Zolotukhin (2014).
Inverted and reference effective temperatures for all objects.
4. Results
Given the “bulk” of nearest neighbours we consider for our inversion procedure, we estimate that 150 K is a typical upper value for the uncertainty in our derived effective temperature. From Fig. 1, we can identify eight major outliers considering deviations from our estimate of the effective temperature and values published and made available through the VizieR service at CDS.
GL 401 is a M3V star. It is also an interesting case, from the point of view of fundamental parameters made available. We retrieved five determinations of its effective temperature, spanning an impressive range of values, as can be seen from the corresponding boxplot in Fig 1. However, our estimate of 3810 K is in excellent agreement with the recent value of 3804 K derived by Gaidos et al. (2014).
The case of the K9V star GL 496.1 is very similar. We extracted six values from VizieR, and again, the most recent value of 4075 K given by Gaidos et al. (2014) is in excellent agreement with our estimate of 4063 K. We also note the very different value of 4685 K given by Santos et al. (2013), and reported at Simbad at CDS for this object.
GL 389.1 is believed to be a K5.5V star (Gray et al. 2006). We could only identify only one data point at VizieR, an estimate of 3990 K given by Lafrasse et al. (2010, also catalogue id. II/320). Our own estimate is significantly hotter at 4450 K, which appears to be more consistent with the spectral type found at Simbad.
According to Simbad at CDS, GL 847 A is a K4 star (Van Leeuwen 2007). This is clearly not consistent with our estimate of an effective temperature of 4160 K, nor with the only value we could retrieve from VizieR, i.e. the estimate by Morales et al. (2008) yielding 3470 K. As for the precedent object, the lack of data available in catalogues makes the assessment of a reliable reference value difficult.
HIP 42108 is a K6V star (Gray et al. 2006) for which we could estimate an effective temperature of 4147 K. From available catalogues, we found the most recent estimate of 4343 K given by McDonald et al. (2012), which is also very close to the alternative estimate of Wright et al. (2003). Lafrasse et al. (2010) also report a very close estimate of 4410 K. For this object, however, Ammons et al. (2006) report a very different value of 6005 K.
A similar case of overestimation has been identified for GL 524.1. We obtained an effective temperature of 4186 K, while Ammons et al. (2006) provide a significantly larger value of 4554 K. Unfortunately, we could not find alternative estimates for this parameter for this object (there is an entry for GL 524.1 reported by Morales et al. 2008, but no Teff value is given).
HIP 56838 is, according to Simbad, a K6V star based on the classification of Gray et al. (2006). Our estimate of its effective temperature is 4200 K, in agreement with a K6 (main sequence) spectral type, while the only VizieR data we could get is 4060 K (Wright et al. 2003). Even though this object can also be found in the Ammons et al. (2006) catalogue, no Teff value is given there. Besides, a much cooler temperature of 3800 K, which would better correspond to a M0V spectral type, was recently given by Kordopatis et al. (2013).
HIP 80083 is quite consistently given at 4800 K (Sousa et al. 2011; Adibekyan et al. 2012; Carretta 2013), or even hotter (Ammons et al. 2006). Our inversion procedure gives an effective temperature significantly lower at 4200 K, typical of a spectral type later than K4, as indicated by Simbad at CDS.
Table 1 summarizes our results. It displays our inverted  and two reference values. The first one,
  , was defined as the value found in VizieR catalogues closest to our estimate, while
  is the median of all catalogue values.
Finally, to characterize our results, we first removed the eight above mentioned outliers from our objects list, which is about 14% of the original sample. Considering reference values as the one closest to our inverted effective temperature, we obtain a (mean signed difference or) bias of 21 K and a standard deviation of 90 K. If we use the median value as reference, the bias is 60 K and the standard deviation 132 K.
5. Conclusion
We have shown that the PCA-based inversion method of Paletou et al. (2015) provides realistic values for the effective temperature of late-type stars. Comparisons made between our estimates and effective temperature data found in the available literature reveals the existence of some strong discrepancies for a few objects. These discrepancies are most often related to very limited samples of estimates, so that additional investigations are clearly required for these objects.
These should consist in using different synthetic spectra, which can produce other radiative modelling tools such as Marcs (Gustafsson et al. 2008) or Phoenix, for cool stars (see e.g. Husser et al. 2013). The consideration of other spectral domains, and eventually the use of a combination of several distinct spectral domains should be explored too.
Our study also raises the more general question of the consistency between published (and made available) data, as well as the consistency between data provided by VizieR and Simbad services.
astroquery.readthedocs.org
Acknowledgments
This research has made use of the VizieR catalogue access tool, CDS, Strasbourg, France. The original description of the VizieR service was published in A&AS 143, 23. This research has made use of the SIMBAD database, operated at CDS, Strasbourg, France.
References
- Adibekyan, V. Zh., Sousa, S. G., Santos, N. C., et al. 2012, A&A, 545, A32 [NASA ADS] [CrossRef] [EDP Sciences] [Google Scholar]
- Allende Prieto, C., Barklem, P. S., Lambert, D. L., & Cunha, K. 2004, A&A, 420, 183 [NASA ADS] [CrossRef] [EDP Sciences] [Google Scholar]
- Ammons, S. M., Robinson, S. E., Strader, J. et al. 2006, ApJ, 638, 1004 [NASA ADS] [CrossRef] [Google Scholar]
- Carretta, E. 2013, A&A, 557, A128 [NASA ADS] [CrossRef] [EDP Sciences] [Google Scholar]
- Gaidos, E., Mann, A. W., Lépine, S., et al. 2014, MNRAS, 443, 2561 [NASA ADS] [CrossRef] [Google Scholar]
- Gray, R. O., Corbally, C. J., Garrison, R. F., et al. 2006, AJ, 132, 161 [NASA ADS] [CrossRef] [Google Scholar]
- Gustafsson, B., Edvardsson, B., Eriksson, K., et al. 2008, A&A, 486, 951 [NASA ADS] [CrossRef] [EDP Sciences] [Google Scholar]
- Hubeny, I., & Lanz, T. 1992, A&A, 262, 501 [NASA ADS] [Google Scholar]
- Husser, T.-O., Wende-von Berg, S., Dreizler, S., et al. 2013, A&A, 553, A6 [NASA ADS] [CrossRef] [EDP Sciences] [Google Scholar]
- Kordopatis, G., Gilmore, G., Steinmetz, M., et al. 2013, AJ, 146, 134 [NASA ADS] [CrossRef] [Google Scholar]
- Kurucz, R. L. 1992, Rev. Mex. Astron. Astrofis., 23, 45 [Google Scholar]
- Kurucz, R. L. 2005, Mem. Soc. Astron. It. Supp., 8, 14 [Google Scholar]
- Lafrasse, S., Mella, G., Bonneau, D., et al. 2010, SPIE Conf. Astronomical Instrumentation, 77344E, 140 [NASA ADS] [Google Scholar]
- McDonald, I., Zijlstra, A. A., & Boyer, M. L. 2012, MNRAS, 427, 343 [NASA ADS] [CrossRef] [Google Scholar]
- Morales, J. C., Ribas, I., & Jordi, C. 2008, A&A, 478, 507 [NASA ADS] [CrossRef] [EDP Sciences] [Google Scholar]
- Paletou, F., & Zolotukhin, I. 2014, ArXiv e-prints [arXiv:1408.7026] [Google Scholar]
- Paletou, F., Böhm, T., Watson, V., & Trouilhet, J.-F. 2015, A&A, 573, A67 [NASA ADS] [CrossRef] [EDP Sciences] [Google Scholar]
- Petit, P., Louge, T., Théado, S., et al. 2014, PASP, 126, 469 [NASA ADS] [CrossRef] [Google Scholar]
- Prugniel, P., Soubiran, C., Koleva, M., & Le Borgne, D. 2007, ArXiv e-prints [arXiv:astro-ph/0703658] [Google Scholar]
- Santos, N. C., Sousa, S. G., Mortier, A., et al. 2013, A&A, 556, A150 [NASA ADS] [CrossRef] [EDP Sciences] [Google Scholar]
- Sousa, S. G., Santos, N. C., Israelian, G., Mayor, M., & Udry, S. 2011, A&A, 533, A141 [NASA ADS] [CrossRef] [EDP Sciences] [Google Scholar]
- van Leeuwen, F. 2007, A&A, 474, 653 [NASA ADS] [CrossRef] [EDP Sciences] [Google Scholar]
- Wright, C. O., Egan, M. P., Kraemer, K. E., & Price, S. D. 2003, AJ, 125, 359 [NASA ADS] [CrossRef] [Google Scholar]
All Tables
All Figures
|
Fig. 1 Comparison between our estimate of effective temperatures (•), and the values we got from available VizieR catalogues. The latter collections are represented as classical boxplots. (The horizontal bar inside each box indicates the median, or Q2 value, while each box extends from first quartile, Q1, to third quartile Q3. Extreme values, still within a 1.5 times the interquartile range away from either Q1 or Q3, are connected to the box with dashed lines. Outliers are denoted by a “+” symbol.) Objects we studied are listed along the horizontal axis. In addition, for each object at level Teff ~ 2800 K, we explicated the number of values found among all VizieR catalogues. |
| In the text | |
Current usage metrics show cumulative count of Article Views (full-text article views including HTML views, PDF and ePub downloads, according to the available data) and Abstracts Views on Vision4Press platform.
Data correspond to usage on the plateform after 2015. The current usage metrics is available 48-96 hours after online publication and is updated daily on week days.
Initial download of the metrics may take a while.