Fig. 1
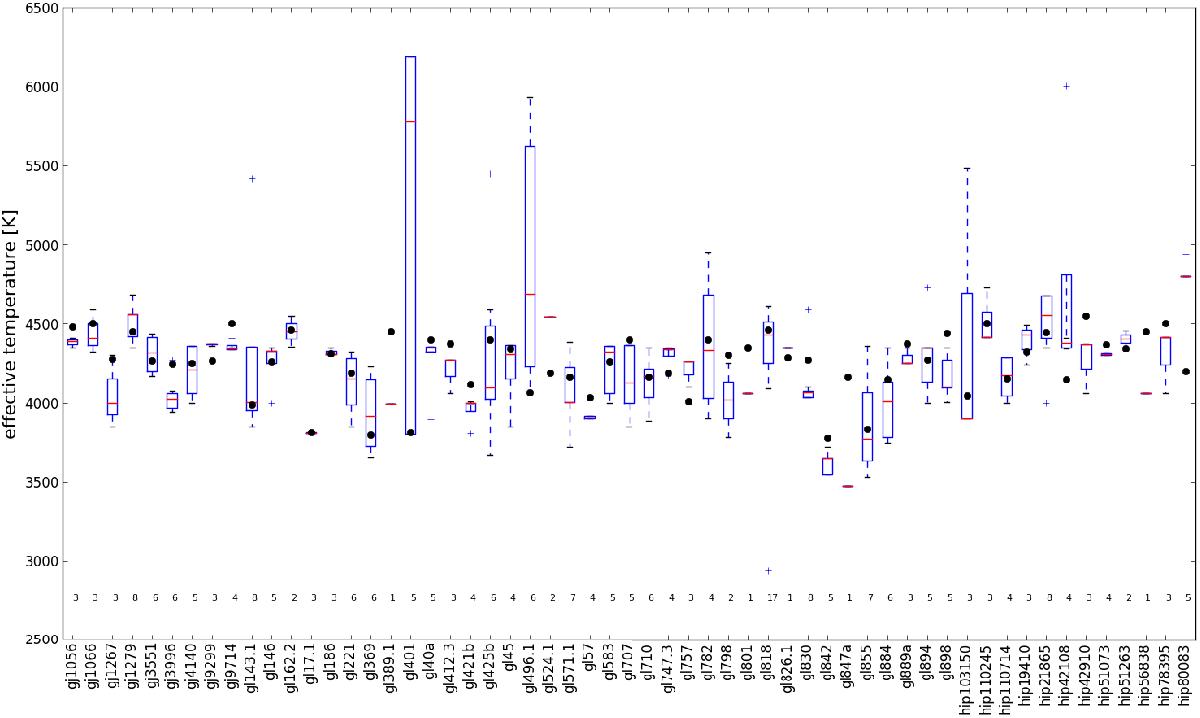
Comparison between our estimate of effective temperatures (•), and the values we got from available VizieR catalogues. The latter collections are represented as classical boxplots. (The horizontal bar inside each box indicates the median, or Q2 value, while each box extends from first quartile, Q1, to third quartile Q3. Extreme values, still within a 1.5 times the interquartile range away from either Q1 or Q3, are connected to the box with dashed lines. Outliers are denoted by a “+” symbol.) Objects we studied are listed along the horizontal axis. In addition, for each object at level Teff ~ 2800 K, we explicated the number of values found among all VizieR catalogues.
Current usage metrics show cumulative count of Article Views (full-text article views including HTML views, PDF and ePub downloads, according to the available data) and Abstracts Views on Vision4Press platform.
Data correspond to usage on the plateform after 2015. The current usage metrics is available 48-96 hours after online publication and is updated daily on week days.
Initial download of the metrics may take a while.