Fig. 2
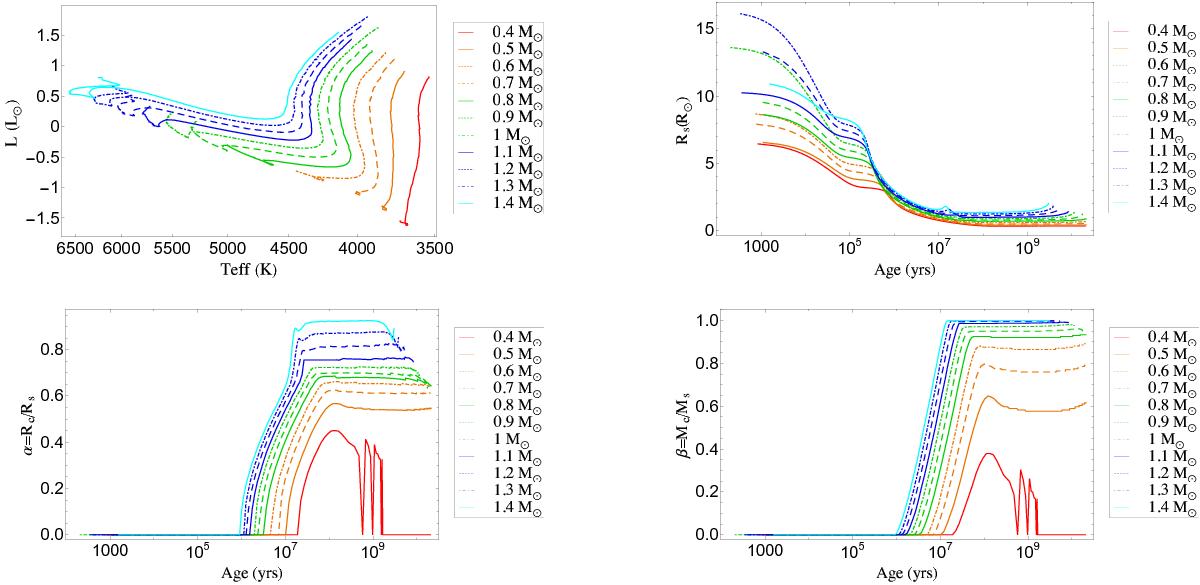
Top-left: track of evolution of stars from 0.4 to 1.4 M⊙ in the Hertzsprung-Russell diagram that gives the luminosity (L) as a function of effective temperature (Teff) (red, orange, green, dark blue, and cyan lines correspond to M-, K-, G-, F-, and A-type stars, respectively). Top-right: evolution of the stellar radius Rs of stars from 0.4 to 1.4 M⊙ as a function of time. Bottom-left: evolution of the radius aspect ratio α = Rc/Rs of stars from 0.4 to 1.4 M⊙ as a function of time. Bottom-right: evolution of the mass aspect ratio β = Mc/Ms of stars from 0.4 to 1.4 M⊙ as a function of time.
Current usage metrics show cumulative count of Article Views (full-text article views including HTML views, PDF and ePub downloads, according to the available data) and Abstracts Views on Vision4Press platform.
Data correspond to usage on the plateform after 2015. The current usage metrics is available 48-96 hours after online publication and is updated daily on week days.
Initial download of the metrics may take a while.