Fig. 9
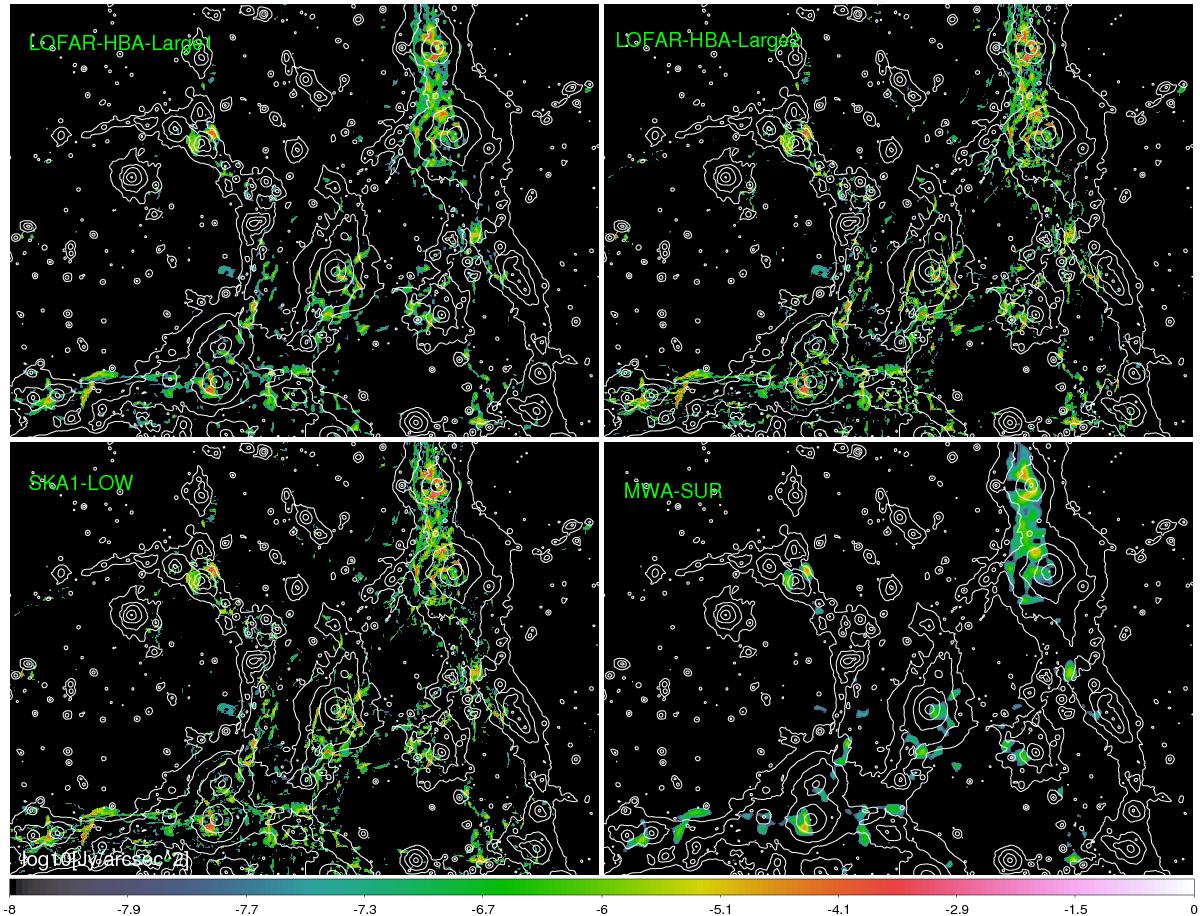
Role of resolution in different radio surveys at low frequency. The colours show the detectable emission by different surveys at low frequency for the HA model (units of log 10 [Jy/arcsec2]), considering a field of view of 5° × 7°. The emission in each map has been convolved with the corresponding resolution beam. The white contours show the projected gas pressure.
Current usage metrics show cumulative count of Article Views (full-text article views including HTML views, PDF and ePub downloads, according to the available data) and Abstracts Views on Vision4Press platform.
Data correspond to usage on the plateform after 2015. The current usage metrics is available 48-96 hours after online publication and is updated daily on week days.
Initial download of the metrics may take a while.