Fig. 8
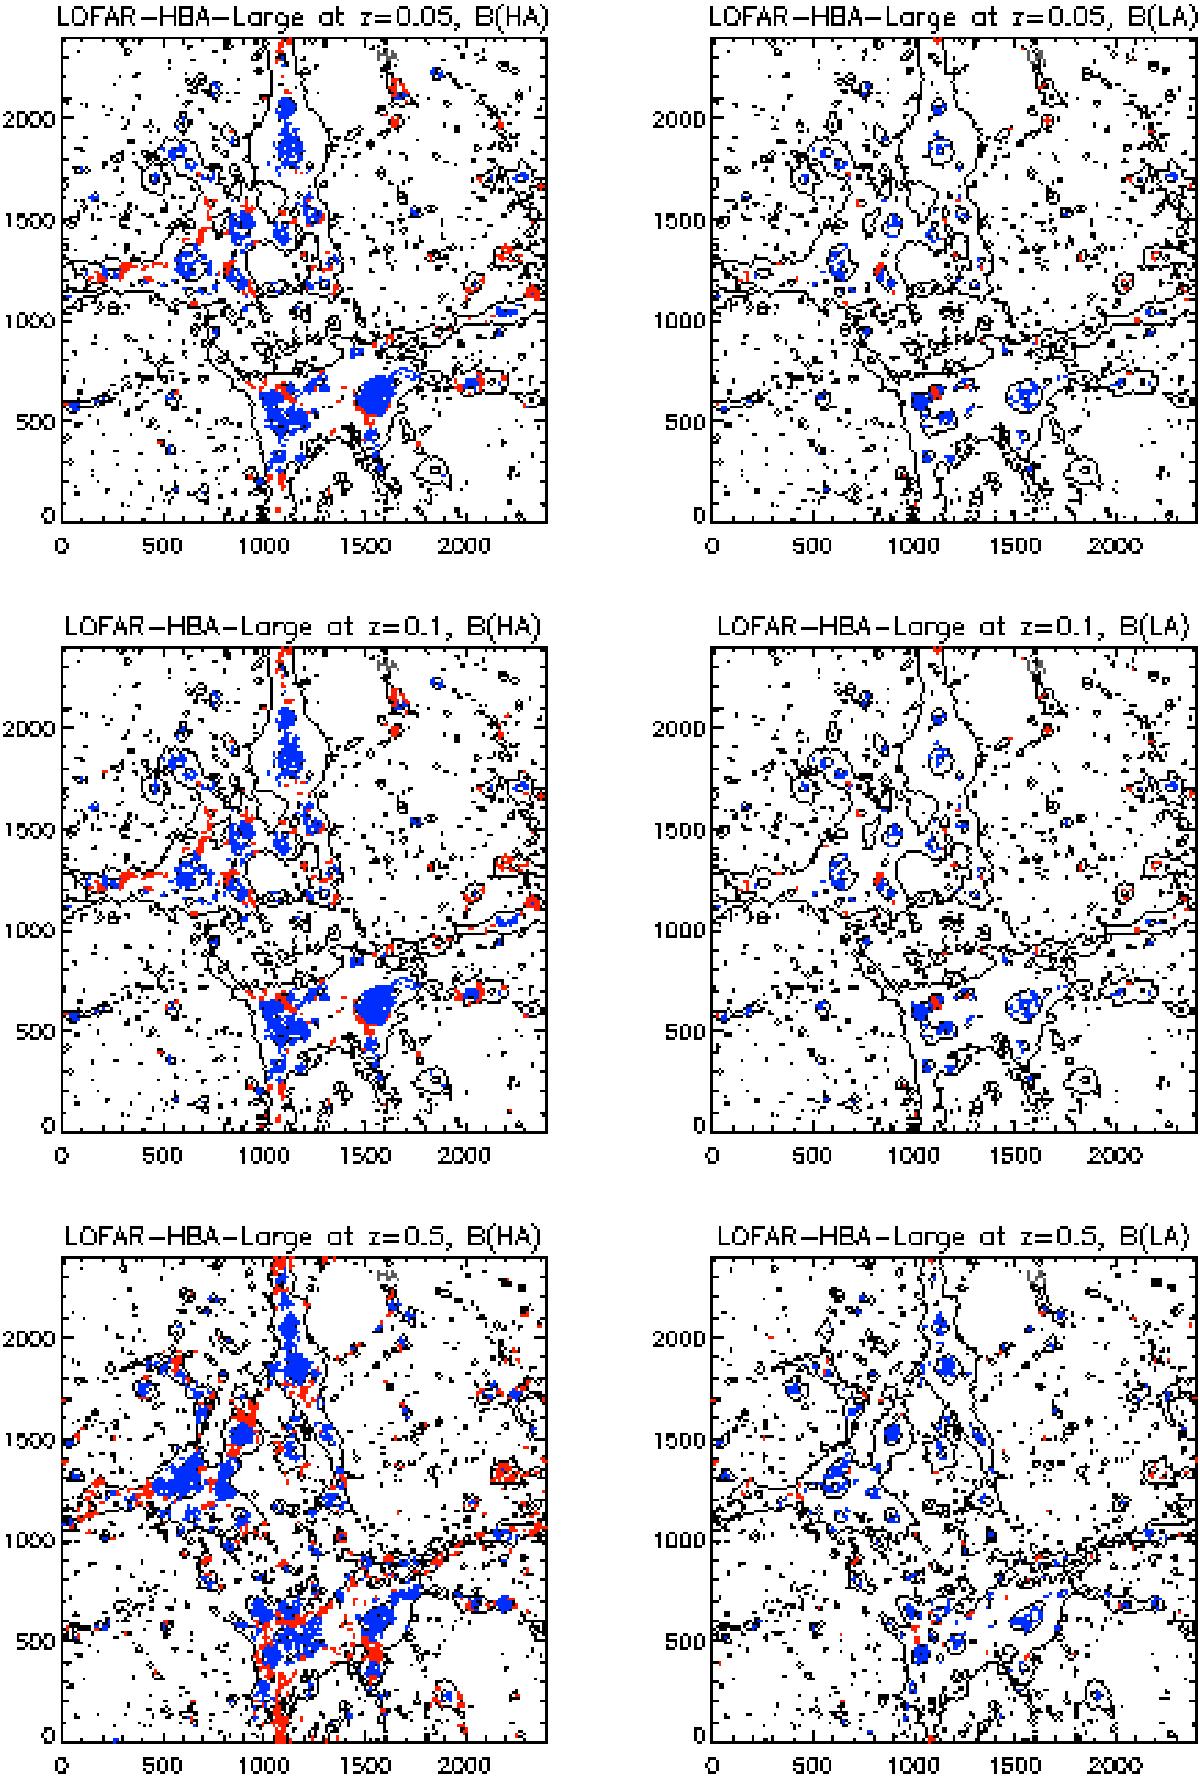
Mock observation of the (50 Mpc)3 volume using the configuration of LOFAR-HBA (Large Survey1, see Table 2) for increasing redshift (z = 0.05, z = 0.1 and z = 0.5) for the HA (left) and LA (right) magnetic field models. The blue and red regions show the emission that is detectable for each model and redshift, divided into emission coming from ≤1.5 rvir (blue) of each identified halo, or generated outside and therefore most likely related to filaments (red). The additional contours show the projected gas pressure. The units of the axes are given in cell units (Δx = 20.8 kpc).
Current usage metrics show cumulative count of Article Views (full-text article views including HTML views, PDF and ePub downloads, according to the available data) and Abstracts Views on Vision4Press platform.
Data correspond to usage on the plateform after 2015. The current usage metrics is available 48-96 hours after online publication and is updated daily on week days.
Initial download of the metrics may take a while.