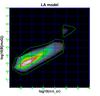
Fig. 2
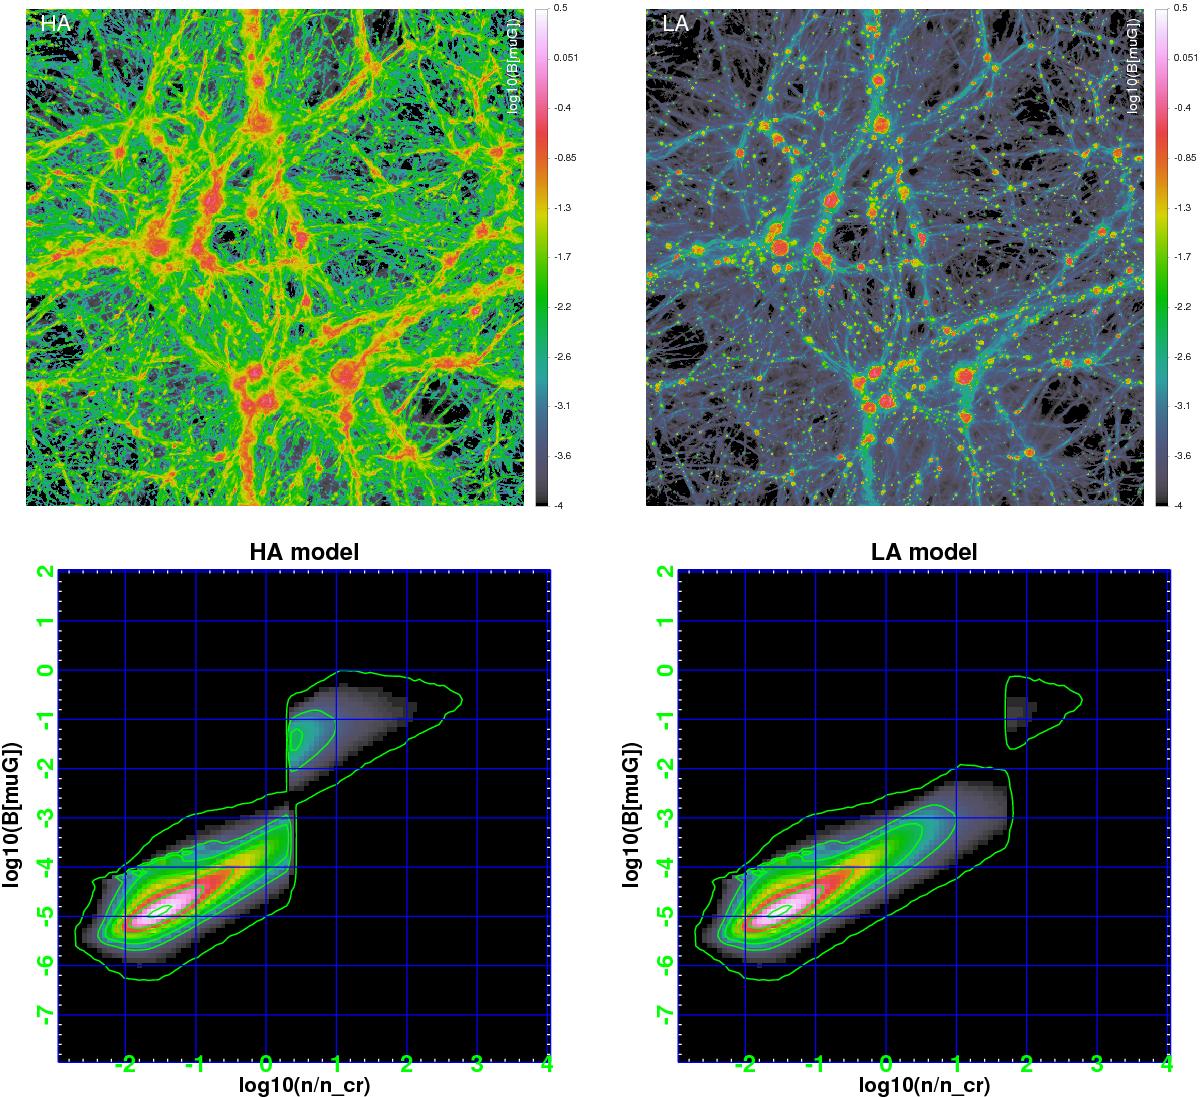
Top panel: mass-weighted magnetic field maps for the HA and LA model, for the same volume as in Fig. 1. The colour bar is in units of log 10( [μG]). Bottom panel: phase diagrams on the (B,n/ncr) plane for the same models. We additionally draw isocontours increased tenfold in the number of cells contributing to the pixels in the phase diagrams, starting from 100 cells.
Current usage metrics show cumulative count of Article Views (full-text article views including HTML views, PDF and ePub downloads, according to the available data) and Abstracts Views on Vision4Press platform.
Data correspond to usage on the plateform after 2015. The current usage metrics is available 48-96 hours after online publication and is updated daily on week days.
Initial download of the metrics may take a while.