Fig. 13
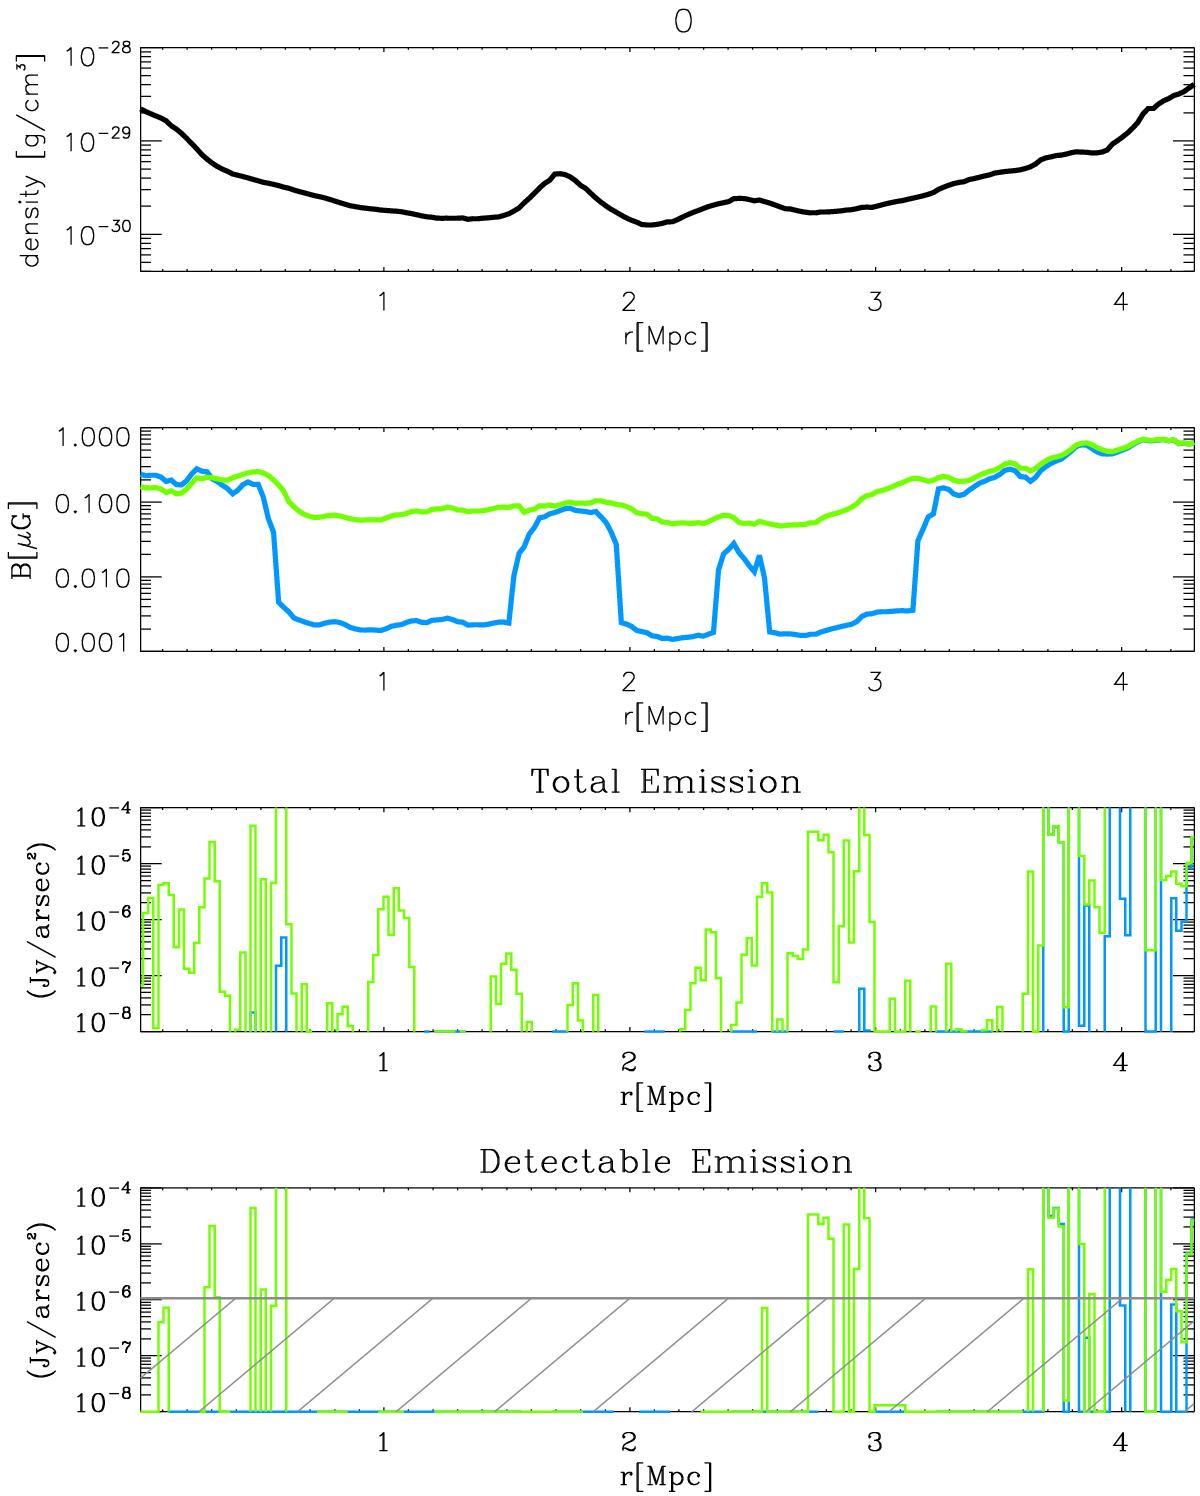
Profiles along the white line in the first panel of Fig. 12, showing the trend of mean gas density along the line of sight, the magnetic field (each colour represents a different model, with blue =LA and green =HA), intrinsic radio emission (same colour coding) and detectable radio emission assuming the sensitivity of LOFAR HBA Large Survey at 120 MHz (resolution of 25′′).
Current usage metrics show cumulative count of Article Views (full-text article views including HTML views, PDF and ePub downloads, according to the available data) and Abstracts Views on Vision4Press platform.
Data correspond to usage on the plateform after 2015. The current usage metrics is available 48-96 hours after online publication and is updated daily on week days.
Initial download of the metrics may take a while.