Fig. 11
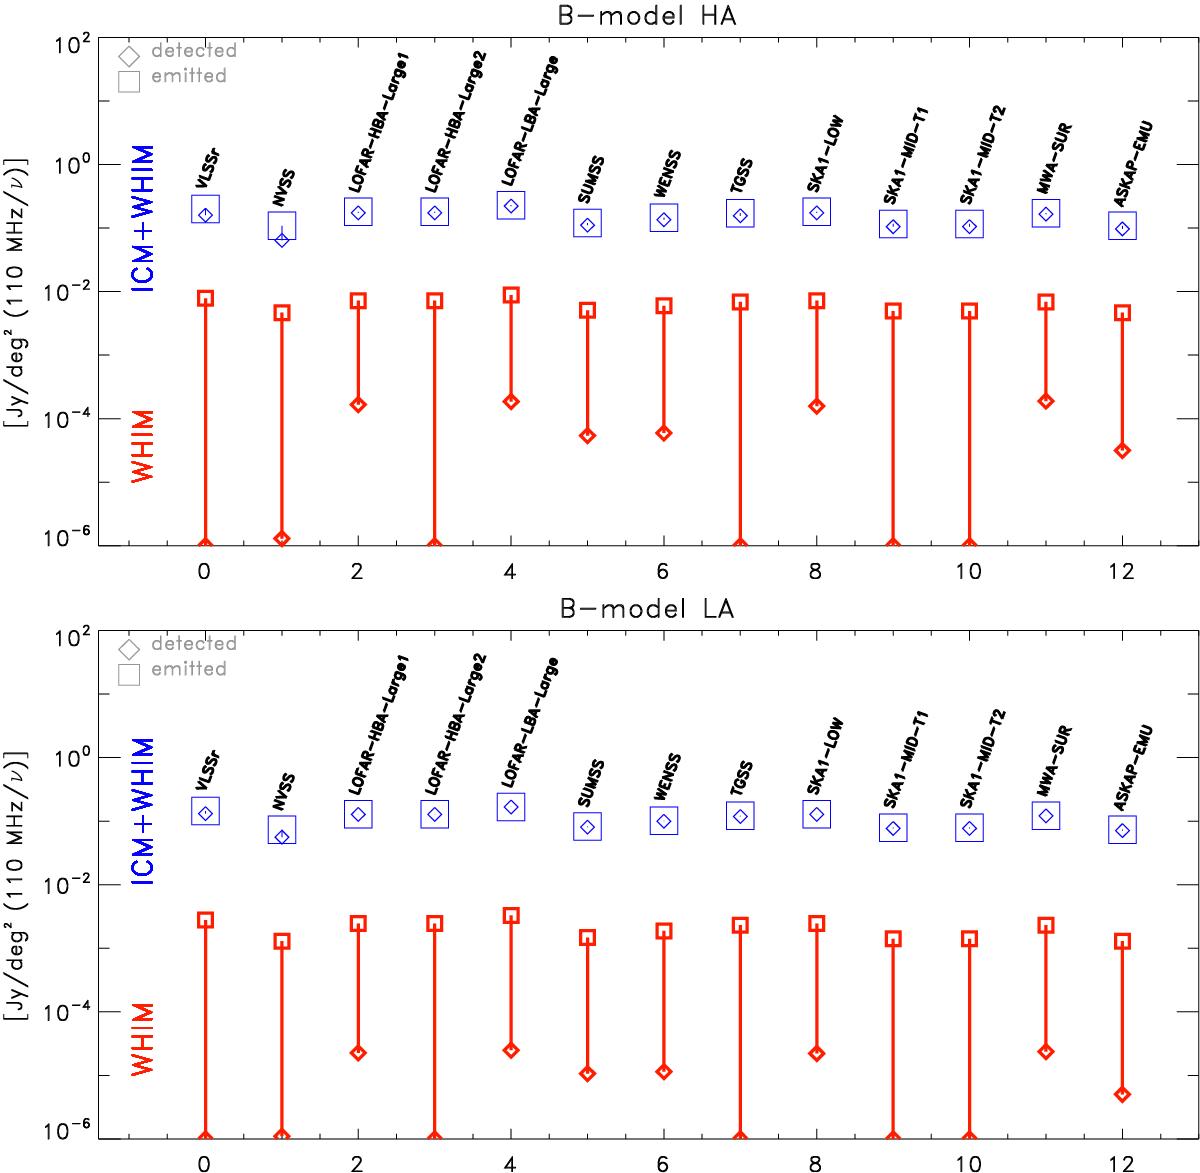
Performance of different radio surveys observing a region of 14° × 14°. We simulated the whole radio-emitting volume from z = 0.02 to z = 0.5 and present for both models the radio emission from the ICM+WHIM (blue) or from the WHIM only (red), distinguishing the total emission (large squares) and the one detected by each survey configuration (small diamonds). All emissions have been rescaled by (110 MHz /ν [MHz]) for better comparison of surveys at different frequencies.
Current usage metrics show cumulative count of Article Views (full-text article views including HTML views, PDF and ePub downloads, according to the available data) and Abstracts Views on Vision4Press platform.
Data correspond to usage on the plateform after 2015. The current usage metrics is available 48-96 hours after online publication and is updated daily on week days.
Initial download of the metrics may take a while.