Fig. 10
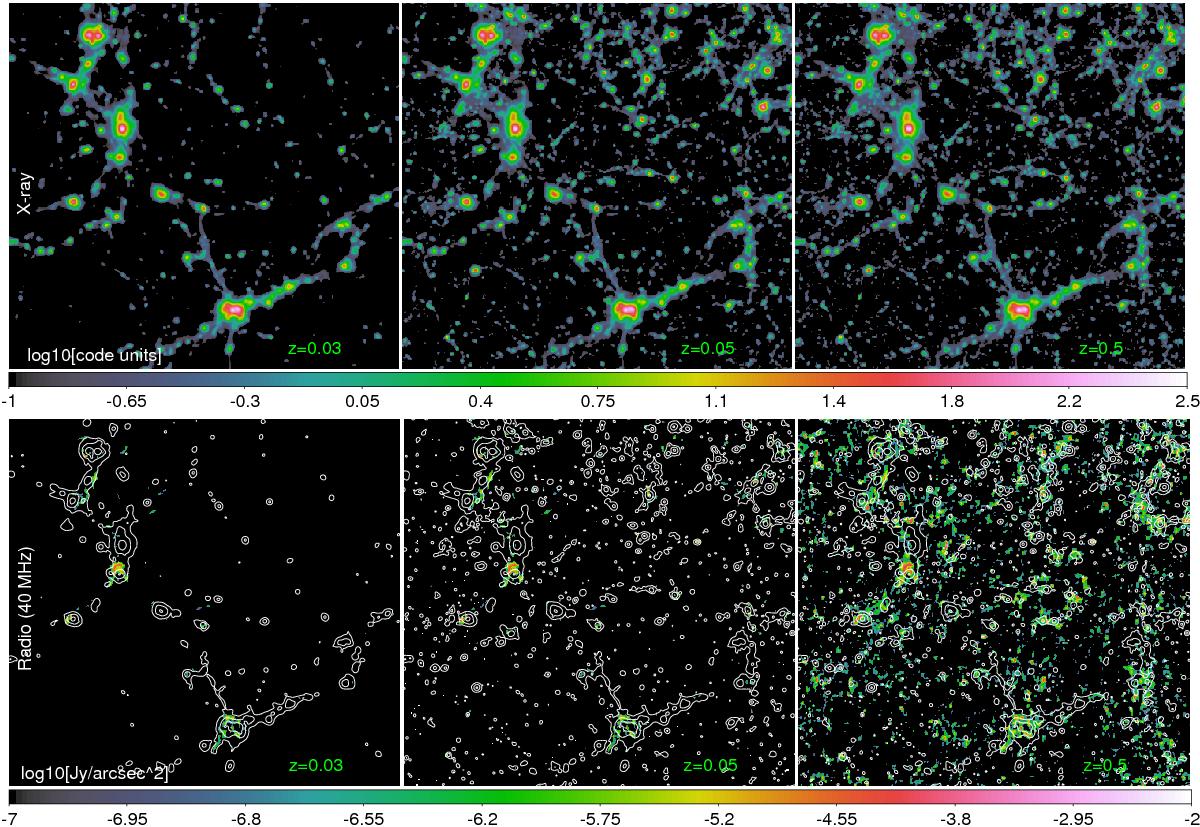
Emission from our simulated light cone at z = 0.03, z = 0.05 and z = 0.5, obtained by stacking replicas of our (100 Mpc)3 and (200 Mpc)3 simulated volumes. The top panels show the total X-ray emission proxy (∝ n2T1/2) and the lower panels show the radio emission for LOFAR-LBA (units of log 10 [Jy/arcsec2]) for a projected area of 3.5° × 3.5°, assuming the high-amplification model (HA). The white contours of the X-ray emission proxy are drawn in the lower panels to allow a better comparison of structures.
Current usage metrics show cumulative count of Article Views (full-text article views including HTML views, PDF and ePub downloads, according to the available data) and Abstracts Views on Vision4Press platform.
Data correspond to usage on the plateform after 2015. The current usage metrics is available 48-96 hours after online publication and is updated daily on week days.
Initial download of the metrics may take a while.