Free Access
Fig. 1
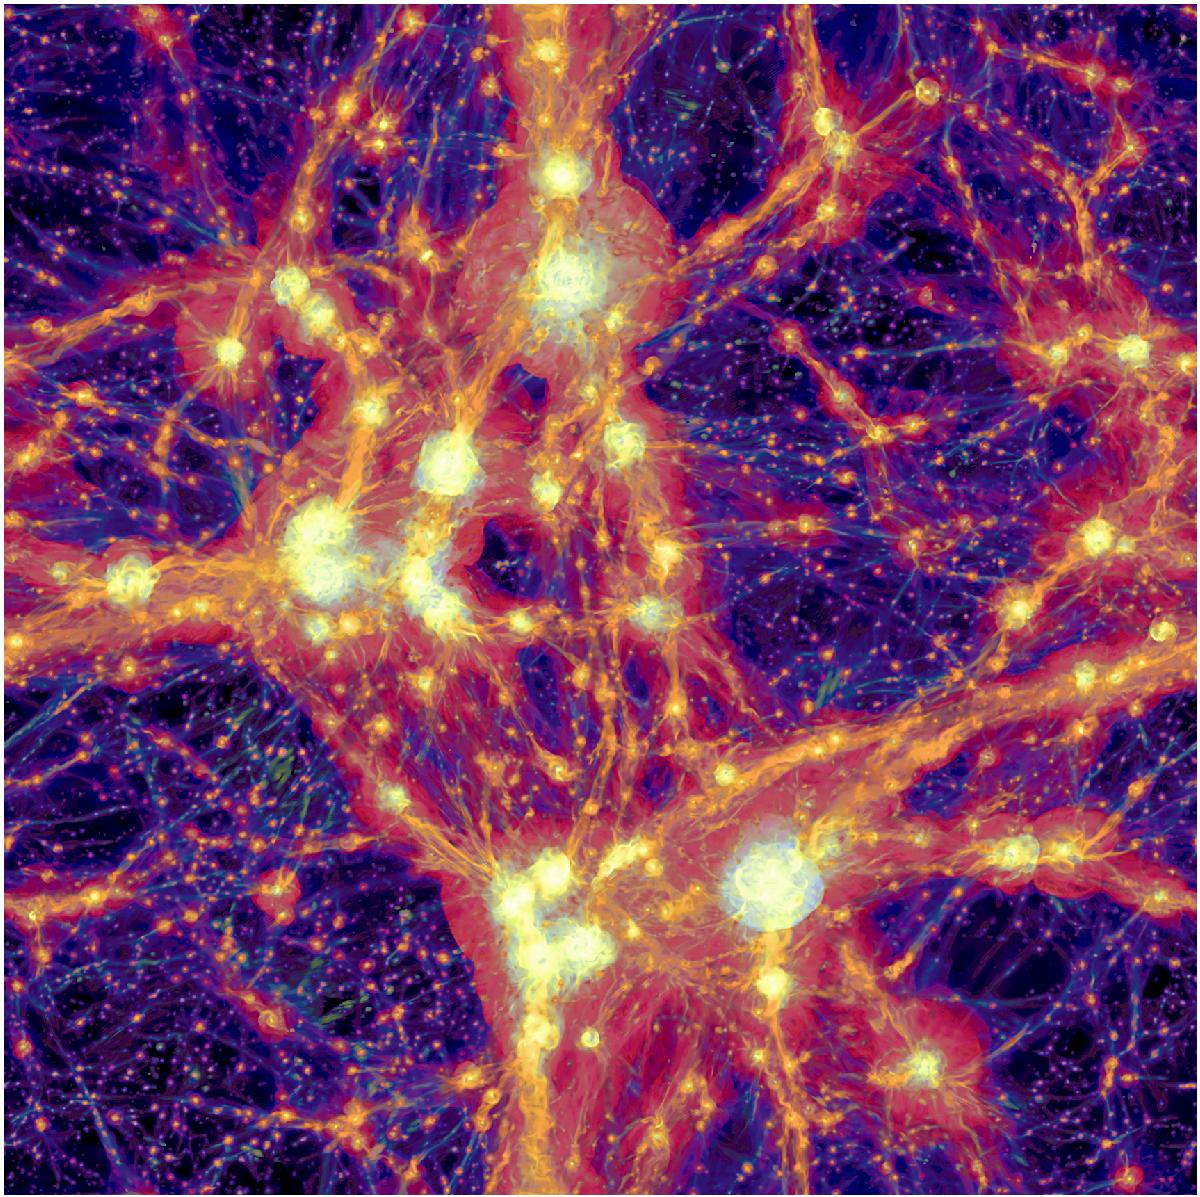
3D rendering of the projected temperature (purple for T ≤ 105 K and red for T ≥ 105 K) and magnetic field intensity (yellow for B ≥ 10 nG and orange for B < 10 nG) for our simulated (50 Mpc)3 volume at z = 0, simulated with 24003 cells and DM particles.
Current usage metrics show cumulative count of Article Views (full-text article views including HTML views, PDF and ePub downloads, according to the available data) and Abstracts Views on Vision4Press platform.
Data correspond to usage on the plateform after 2015. The current usage metrics is available 48-96 hours after online publication and is updated daily on week days.
Initial download of the metrics may take a while.