Fig. 8
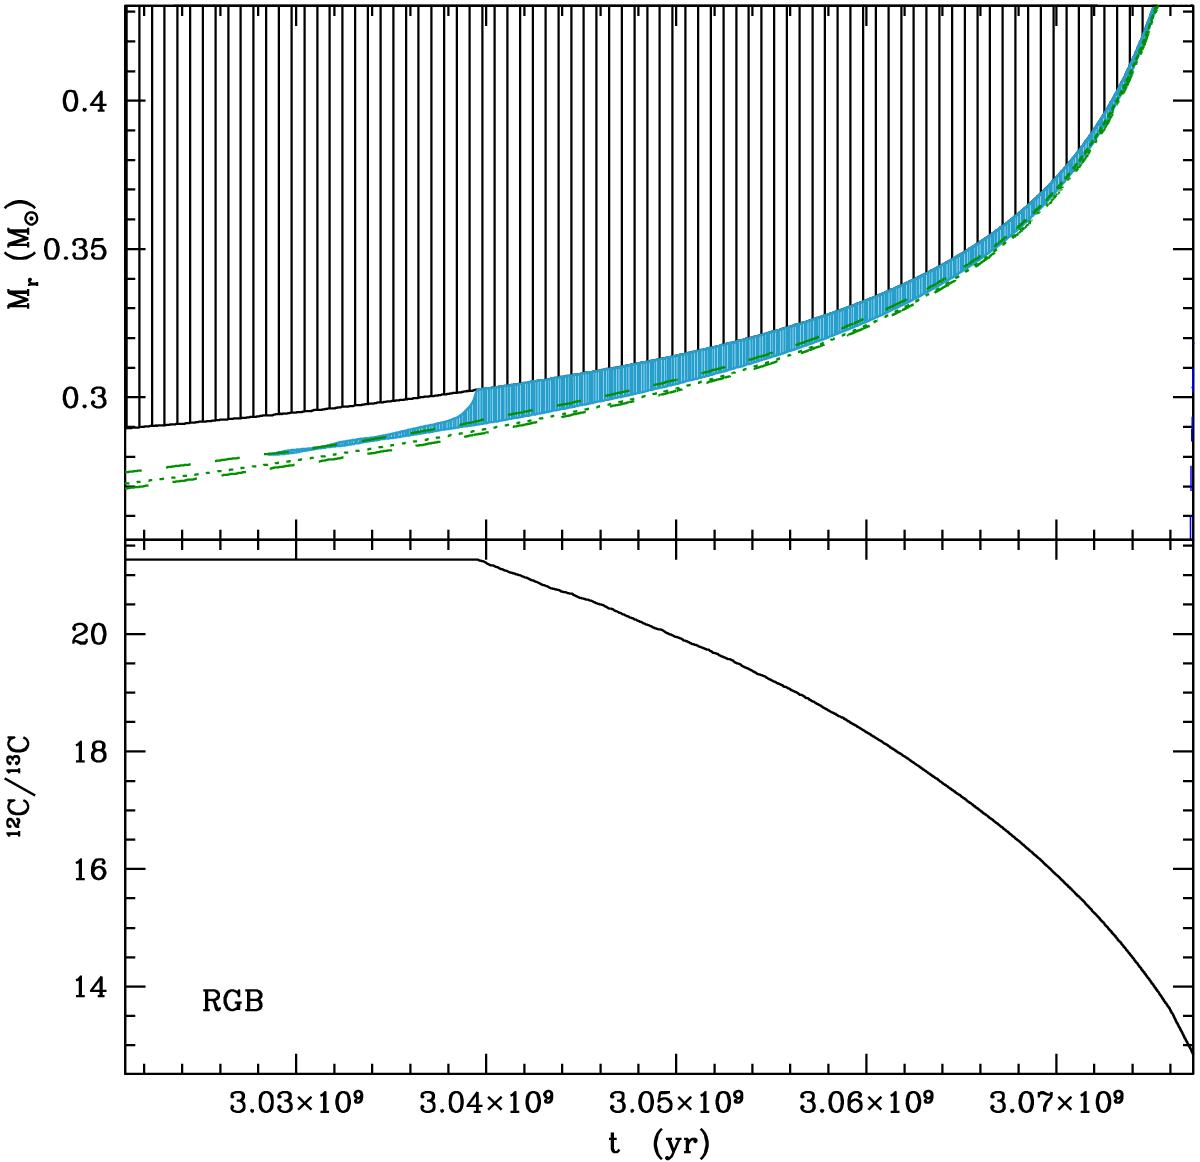
Top panel: Kippenhahn diagram for the 1.5 M⊙ star computed with thermohaline instability and rotation-induced mixing. Here we focus on the red giant branch. Green dashed lines delimit the hydrogen-burning shell above the degenerate helium core, and the dotted line shows the region of maximum nuclear energy production. The region where thermohaline instability takes place is indicated in blue. Bottom panel: evolution of 12C/13C during the RGB.
Current usage metrics show cumulative count of Article Views (full-text article views including HTML views, PDF and ePub downloads, according to the available data) and Abstracts Views on Vision4Press platform.
Data correspond to usage on the plateform after 2015. The current usage metrics is available 48-96 hours after online publication and is updated daily on week days.
Initial download of the metrics may take a while.