Fig. 6
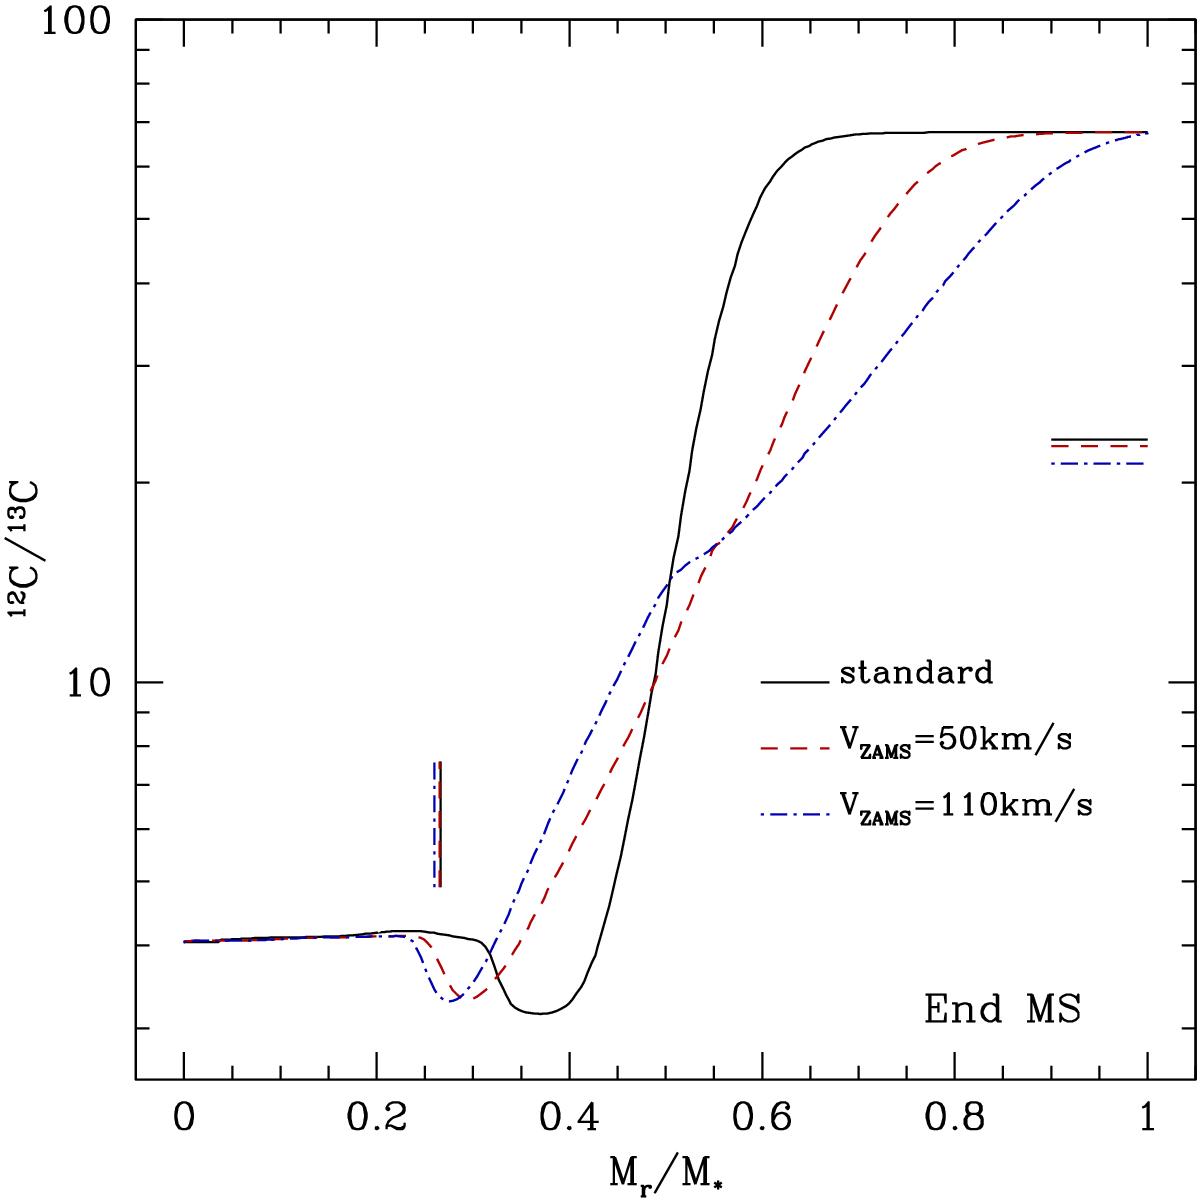
Chemical profiles of carbon isotopic ratio as a function of coordinate in mass (Mr/M⊙) at the turn-off of the 1.5 M⊙ star computed with different initial rotation velocities. The black solid, red dashed, and blue dot-dashed lines represent standard models, models including rotation with VZAMS = 50 km s-1, and 110 km s-1, respectively. The vertical lines show, in all cases, the maximum depth reached by the convective envelope at its maximum extent during the first dredge-up, while the horizontal lines indicate the surface values of 12C/13C at the end of the first dredge-up.
Current usage metrics show cumulative count of Article Views (full-text article views including HTML views, PDF and ePub downloads, according to the available data) and Abstracts Views on Vision4Press platform.
Data correspond to usage on the plateform after 2015. The current usage metrics is available 48-96 hours after online publication and is updated daily on week days.
Initial download of the metrics may take a while.