Fig. 5
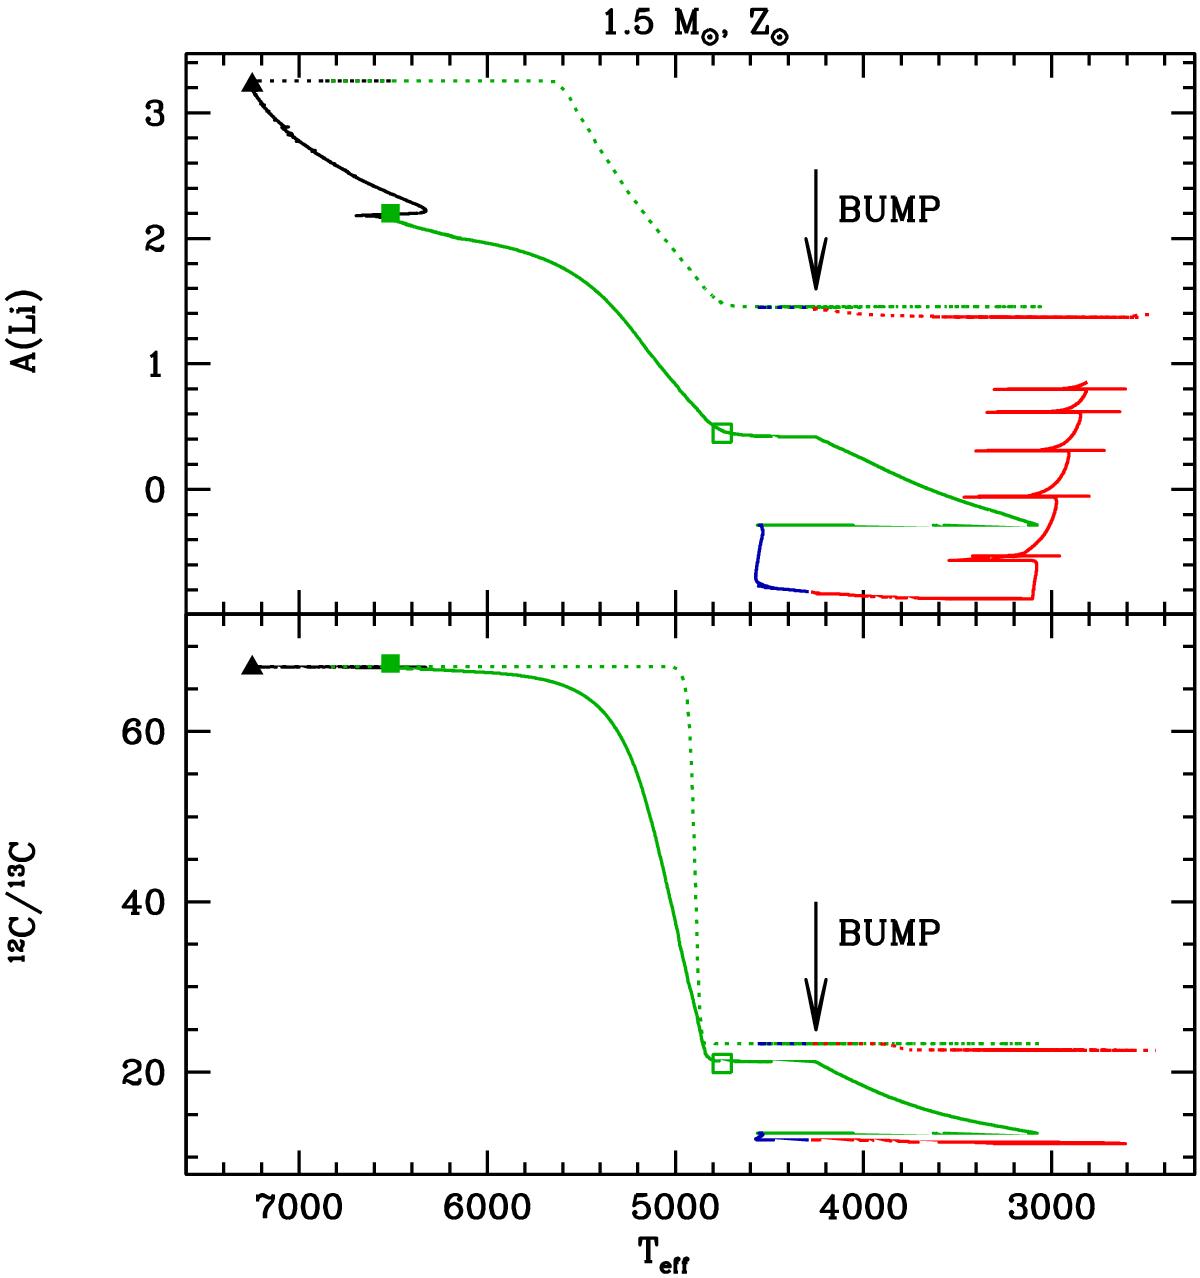
Evolution of the lithium surface abundances (A(Li) = log(![]() ), with X(Li) the lithium mass fraction), and carbon isotopic ratio as functions of effective temperature. Predictions are shown for 1.5 M⊙ models at solar metallicity computed following standard prescriptions (dotted line) and including rotation-induced mixing as well as thermohaline instability (VZAMS = 110 km s-1), from the ZAMS up to the TP-AGB phase (solid line). Evolutionary phases are indicated by a colour label: main sequence (black), red giant branch (green), He-burning phase (blue), and asymptotic giant branch (red). ZAMS (black triangle) and first dredge-up (start/end; full/open squares) are indicated.
), with X(Li) the lithium mass fraction), and carbon isotopic ratio as functions of effective temperature. Predictions are shown for 1.5 M⊙ models at solar metallicity computed following standard prescriptions (dotted line) and including rotation-induced mixing as well as thermohaline instability (VZAMS = 110 km s-1), from the ZAMS up to the TP-AGB phase (solid line). Evolutionary phases are indicated by a colour label: main sequence (black), red giant branch (green), He-burning phase (blue), and asymptotic giant branch (red). ZAMS (black triangle) and first dredge-up (start/end; full/open squares) are indicated.
Current usage metrics show cumulative count of Article Views (full-text article views including HTML views, PDF and ePub downloads, according to the available data) and Abstracts Views on Vision4Press platform.
Data correspond to usage on the plateform after 2015. The current usage metrics is available 48-96 hours after online publication and is updated daily on week days.
Initial download of the metrics may take a while.