Fig. 13
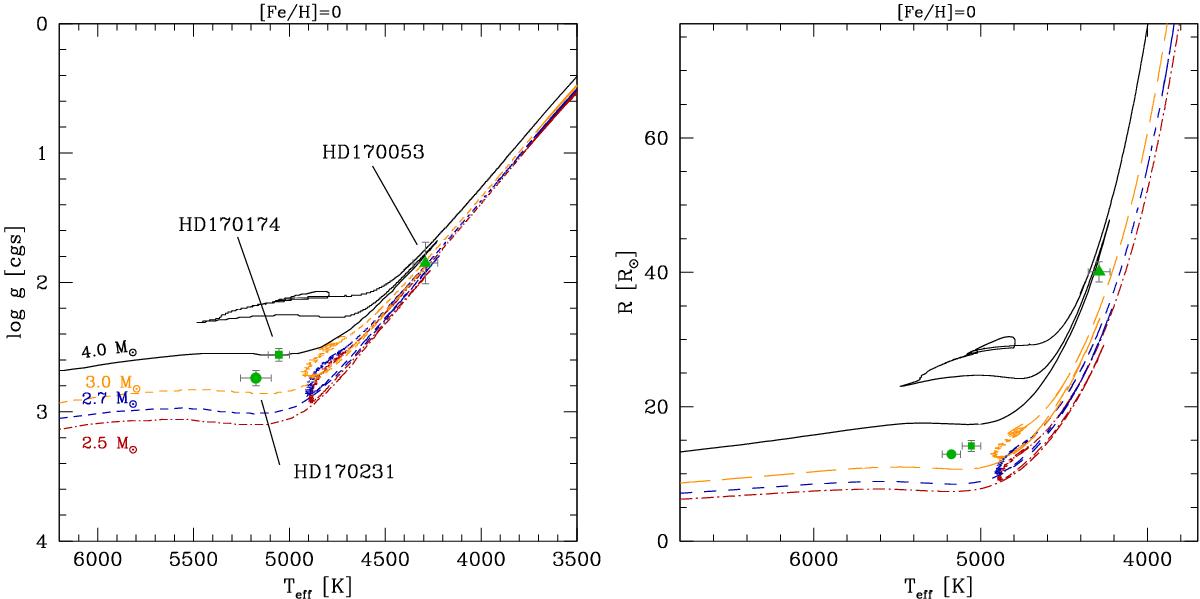
Theoretical evolutionary tracks plotted in log g − Teff diagram (left panel) and stellar radius (right panel) (from the main sequence up to the early-AGB) computed with thermohaline instability and rotation-induced mixing at solar metallicity for 4.0 M⊙ (VZAMS = 144 km s-1, solid black line), 3.0 M⊙ (VZAMS = 136 km s-1, orange long dashed line), 2.7 M⊙ (VZAMS = 110 km s-1, blue dashed line), and 2.5 M⊙ (VZAMS = 110 km s-1, red dashed line). Cluster members discussed in this study are indicated by green circle (HD 170231), square (HD 170174), and triangle (HD 170053).
Current usage metrics show cumulative count of Article Views (full-text article views including HTML views, PDF and ePub downloads, according to the available data) and Abstracts Views on Vision4Press platform.
Data correspond to usage on the plateform after 2015. The current usage metrics is available 48-96 hours after online publication and is updated daily on week days.
Initial download of the metrics may take a while.