Fig. 12
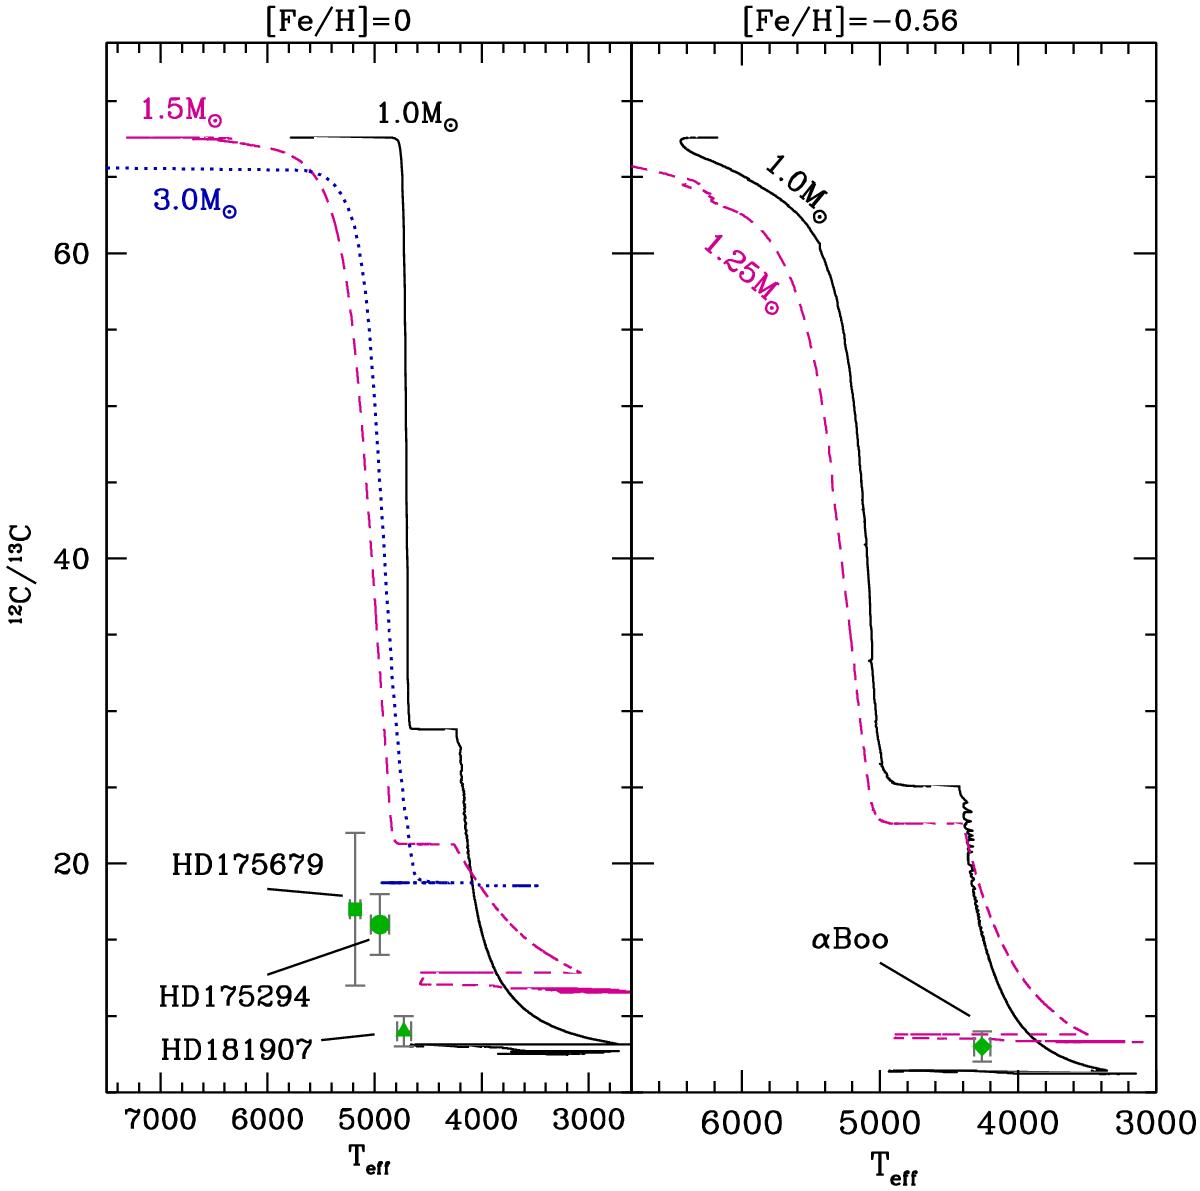
12C/13C data in our red giant stars that are segregated according to their metallicity (left and right panels include respectively sample stars with metallicity close to solar and [Fe/H] = −0.56). Same symbols as in Fig. 11. Theoretical 12C/13C surface abundance is shown from the ZAMS up to the TP-AGB. Various lines correspond to predictions of stellar models of different masses including effects of rotation-induced mixing (with an initial VZAMS/Vcrit = 0.30) and thermohaline instability.
Current usage metrics show cumulative count of Article Views (full-text article views including HTML views, PDF and ePub downloads, according to the available data) and Abstracts Views on Vision4Press platform.
Data correspond to usage on the plateform after 2015. The current usage metrics is available 48-96 hours after online publication and is updated daily on week days.
Initial download of the metrics may take a while.