Fig. 10
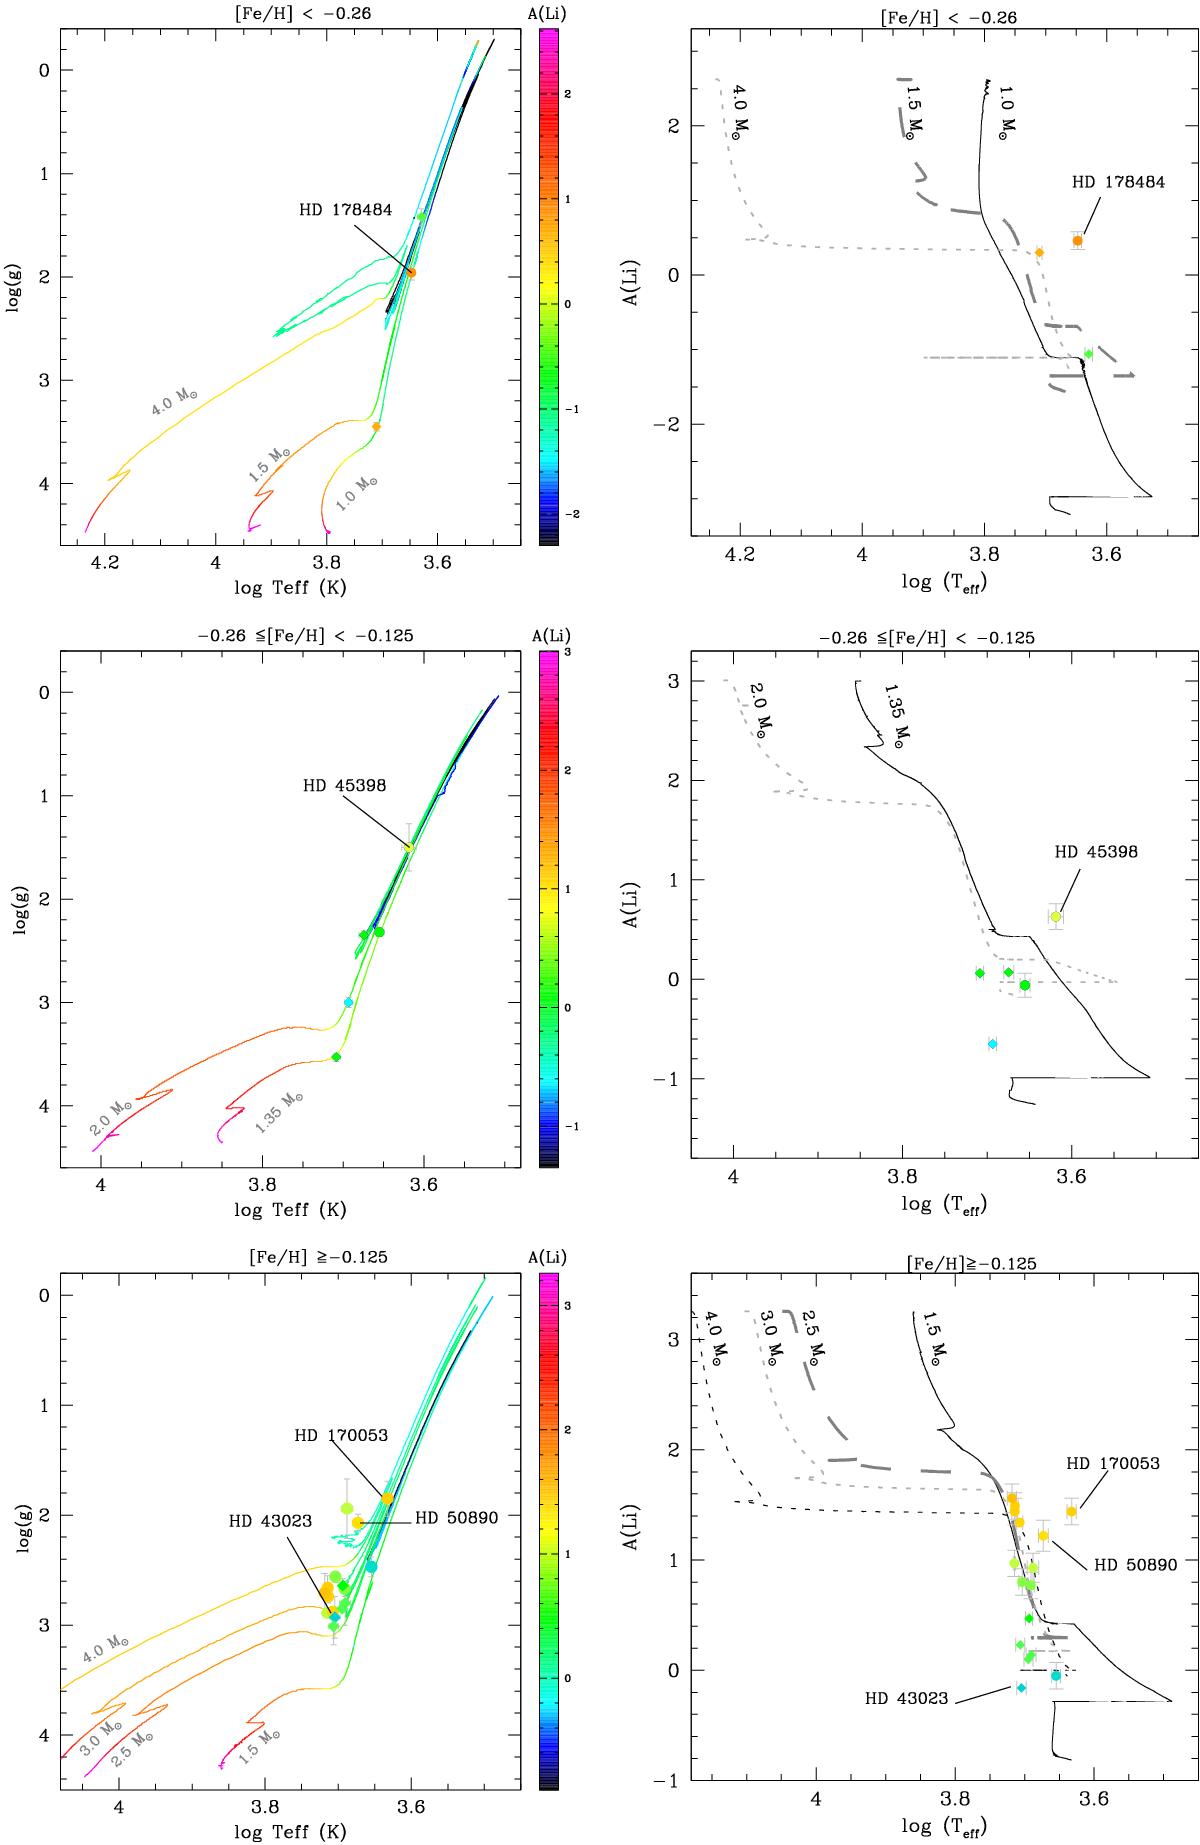
Left panels: colour-coded Hertzsprung-Russell diagram for different stellar masses. The colour code represents the values of A(Li) at the stellar surface. Right panels: the evolution of surface lithium abundance (from the ZAMS to the end of the He-burning phase) as a function of effective temperature. Circles and diamonds denote, respectively, Li detections and upper limits for stars with [Fe/H] <−0.26 (top panels), −0.26 ≤ [Fe/H] <−0.125 (middle panels), and [Fe/H] ≥−0.125 (bottom panels). Error bars are shown for all stars.
Current usage metrics show cumulative count of Article Views (full-text article views including HTML views, PDF and ePub downloads, according to the available data) and Abstracts Views on Vision4Press platform.
Data correspond to usage on the plateform after 2015. The current usage metrics is available 48-96 hours after online publication and is updated daily on week days.
Initial download of the metrics may take a while.