Fig. 7
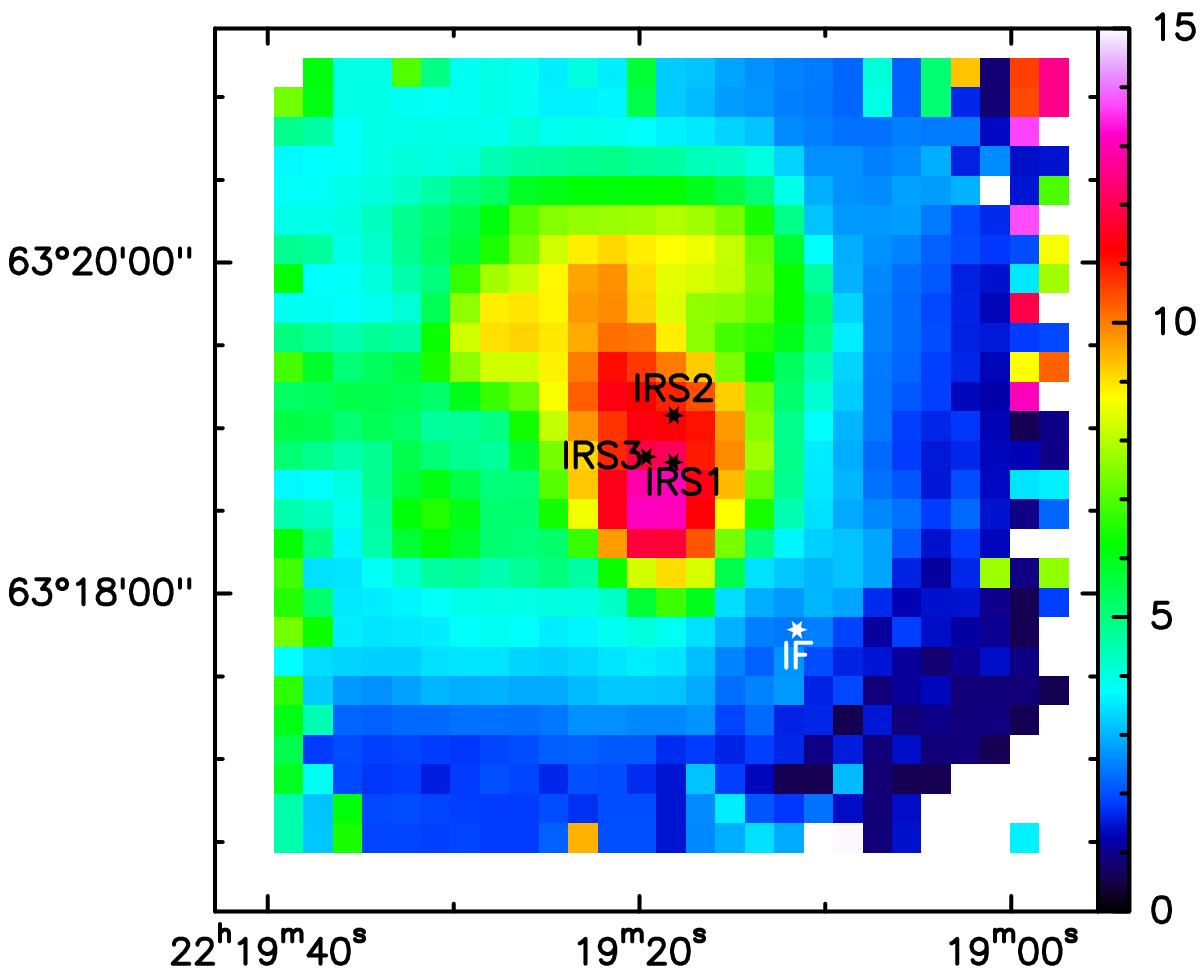
Line width as observed throughout the cloud. The FWHMs were derived from a 2nd moment map of the line emission. Broader profiles appear toward the center (>10 km s-1), where the three infrared sources are located, and narrower toward the ionization front (<5 kms-1). The FWHM that characterizes the gas that surrounds the protostars varies between ~5−10 kms-1.
Current usage metrics show cumulative count of Article Views (full-text article views including HTML views, PDF and ePub downloads, according to the available data) and Abstracts Views on Vision4Press platform.
Data correspond to usage on the plateform after 2015. The current usage metrics is available 48-96 hours after online publication and is updated daily on week days.
Initial download of the metrics may take a while.