Fig. 23
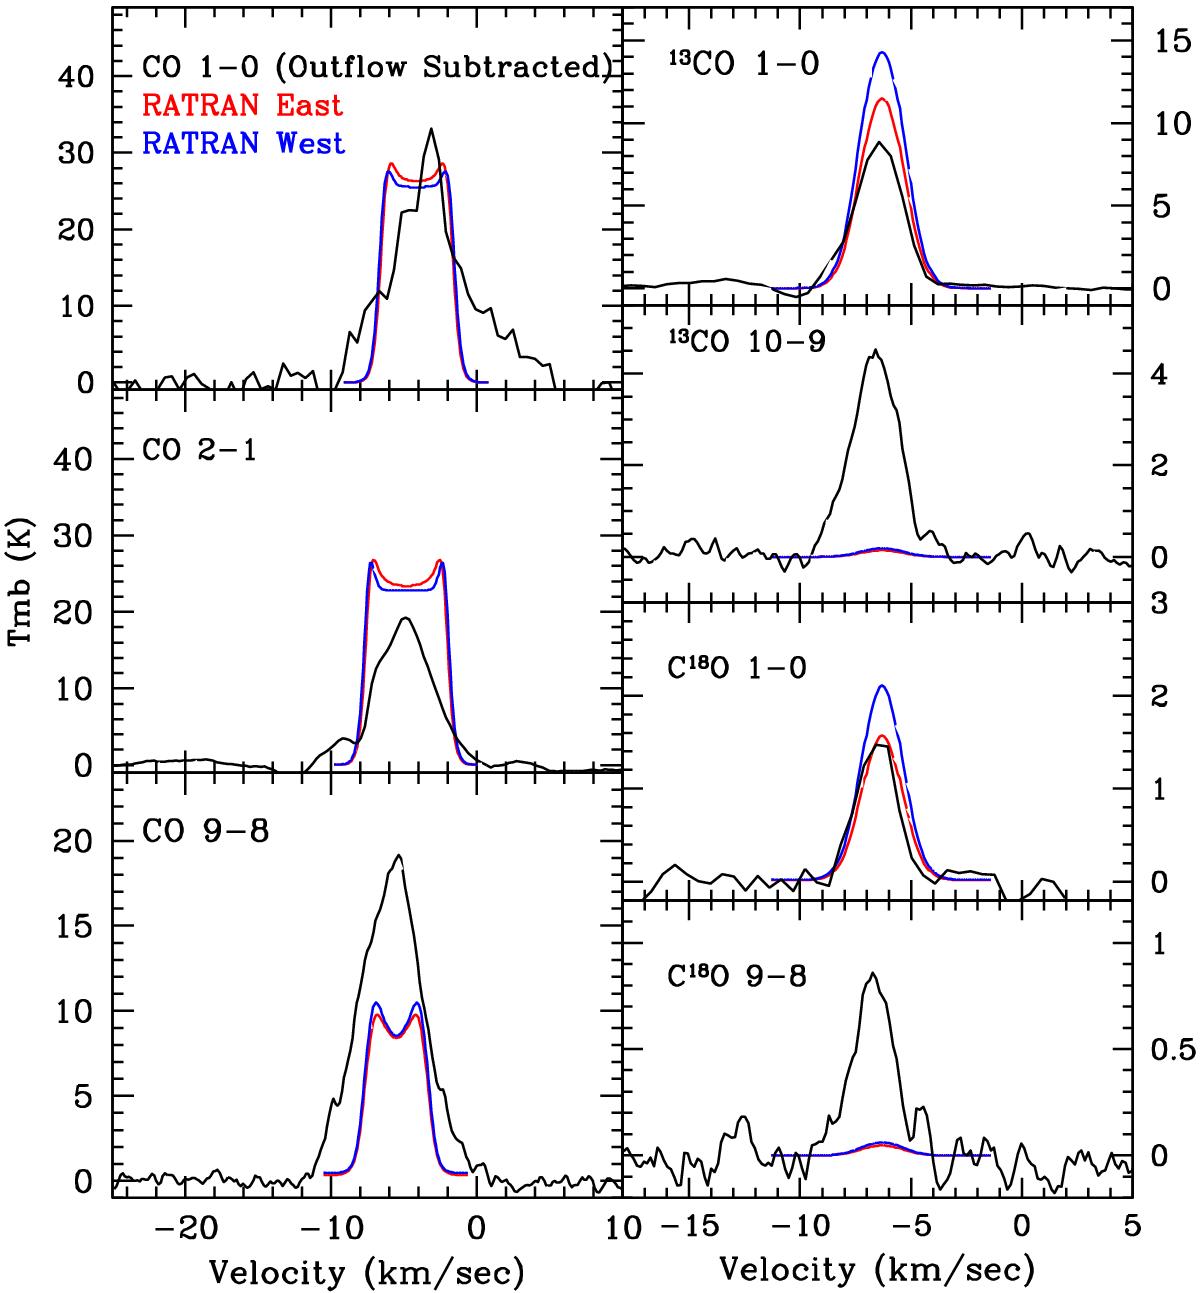
Outflow-subtracted spectra of CO 1−0, CO 2−1, CO 9−8, 13CO 1−0, 13CO 10−9, C18O 1−0, and C18O 9−8 (black) as observed toward IRS 1, overplotted with the synthetic emission as calculated with RATRAN, after having applied the lower density east hemisphere from DUSTY models (red) and the high density west hemisphere (blue). We observe no significant differences between the two cases with the exception of the low-J transitions of the isotopologues. While the model fits the observations for the lower transition lines well, it fails to reproduce the observed higher transition lines.
Current usage metrics show cumulative count of Article Views (full-text article views including HTML views, PDF and ePub downloads, according to the available data) and Abstracts Views on Vision4Press platform.
Data correspond to usage on the plateform after 2015. The current usage metrics is available 48-96 hours after online publication and is updated daily on week days.
Initial download of the metrics may take a while.