Free Access
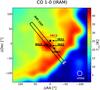
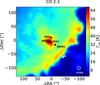
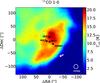
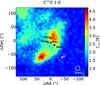
Fig. 2
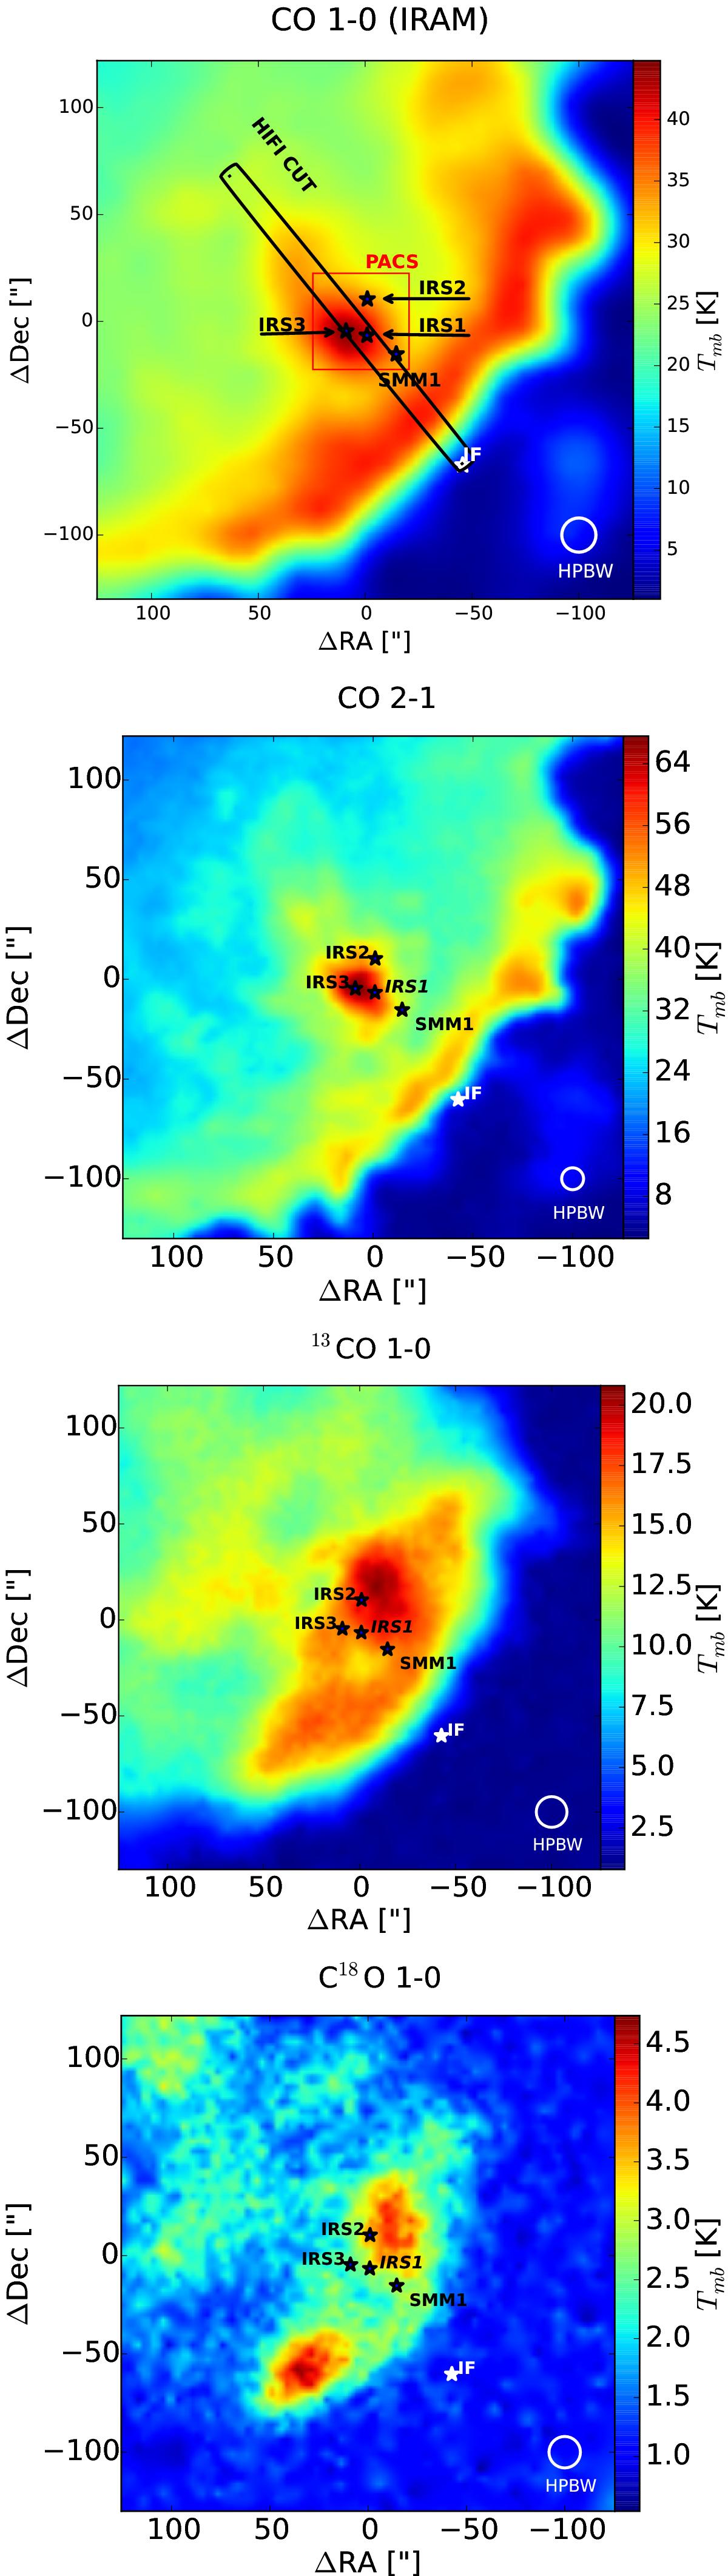
Spatial distribution of CO 1−0, CO 2−1, 13CO 1−0, and C18O 1−0 peak intensities (HIFI cut and PACS overplotted). The IRS 1−3 positions were taken from Evans et al. (1989) & SMM 1 from Maud et al. (2013). The center is at RA = 22:19:18.30, Dec = 63:18:54.2 (J2000).
This figure is made of several images, please see below:
Current usage metrics show cumulative count of Article Views (full-text article views including HTML views, PDF and ePub downloads, according to the available data) and Abstracts Views on Vision4Press platform.
Data correspond to usage on the plateform after 2015. The current usage metrics is available 48-96 hours after online publication and is updated daily on week days.
Initial download of the metrics may take a while.