Fig. 18
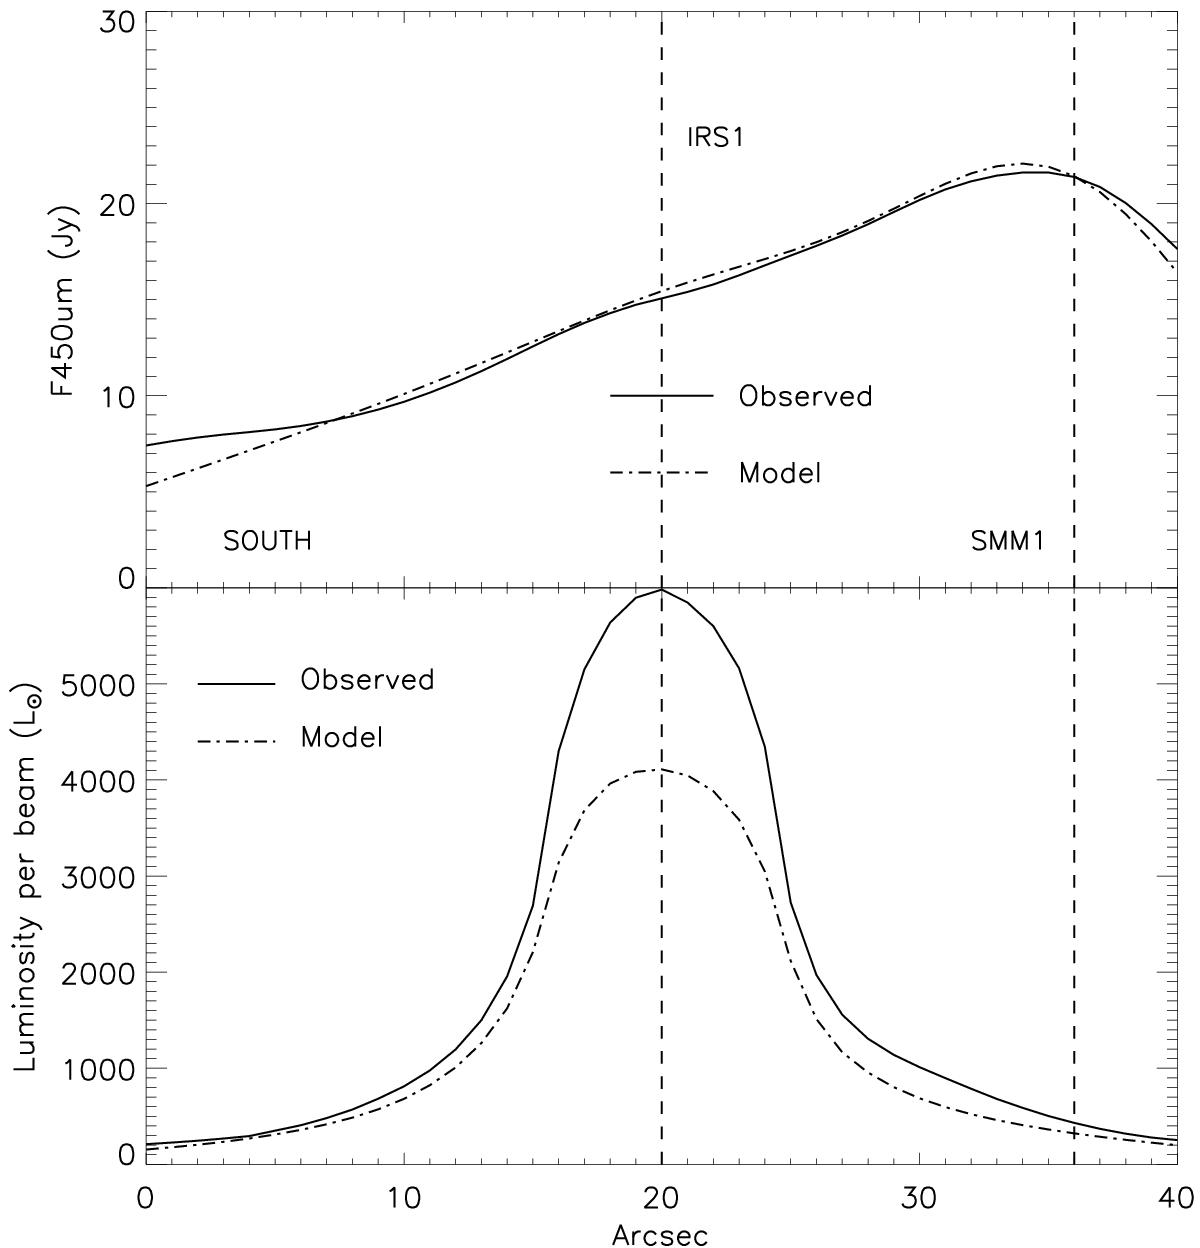
Profiles along the same line as used in Fig. 15 for the 450 μm flux (top panel) and the total luminosity (bottom panel). We note the significant mismatch in the central region, which is due to not trying to fit the 5−30 μm luminosity, since some of it likely arises from an axisymmetric disk rather than the spherical model used here.
Current usage metrics show cumulative count of Article Views (full-text article views including HTML views, PDF and ePub downloads, according to the available data) and Abstracts Views on Vision4Press platform.
Data correspond to usage on the plateform after 2015. The current usage metrics is available 48-96 hours after online publication and is updated daily on week days.
Initial download of the metrics may take a while.