Free Access
Fig. 17
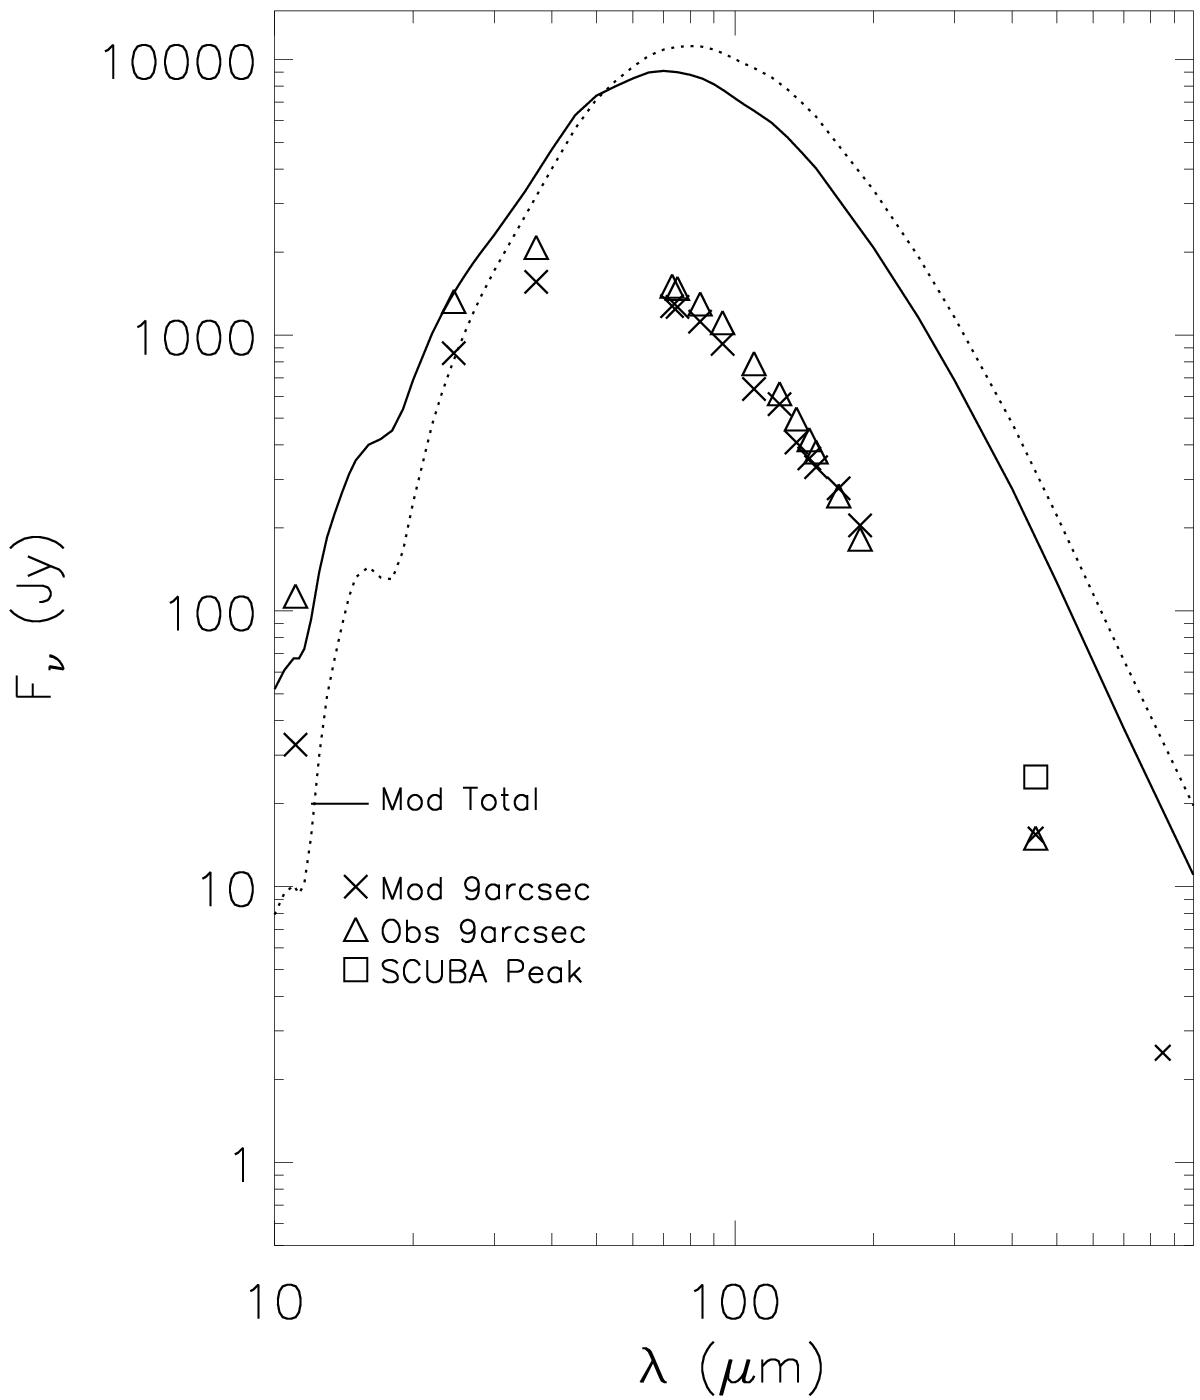
SED for a typical model fit with low χ2. The solid line shows the total flux coming from the warm hemisphere, and the dotted line shows the SED for the fraction of the flux coming from the cold hemisphere. The plotted symbols show the observed and model fluxes for the fraction within the central 9′′ PACS pixel.
Current usage metrics show cumulative count of Article Views (full-text article views including HTML views, PDF and ePub downloads, according to the available data) and Abstracts Views on Vision4Press platform.
Data correspond to usage on the plateform after 2015. The current usage metrics is available 48-96 hours after online publication and is updated daily on week days.
Initial download of the metrics may take a while.