Fig. 12
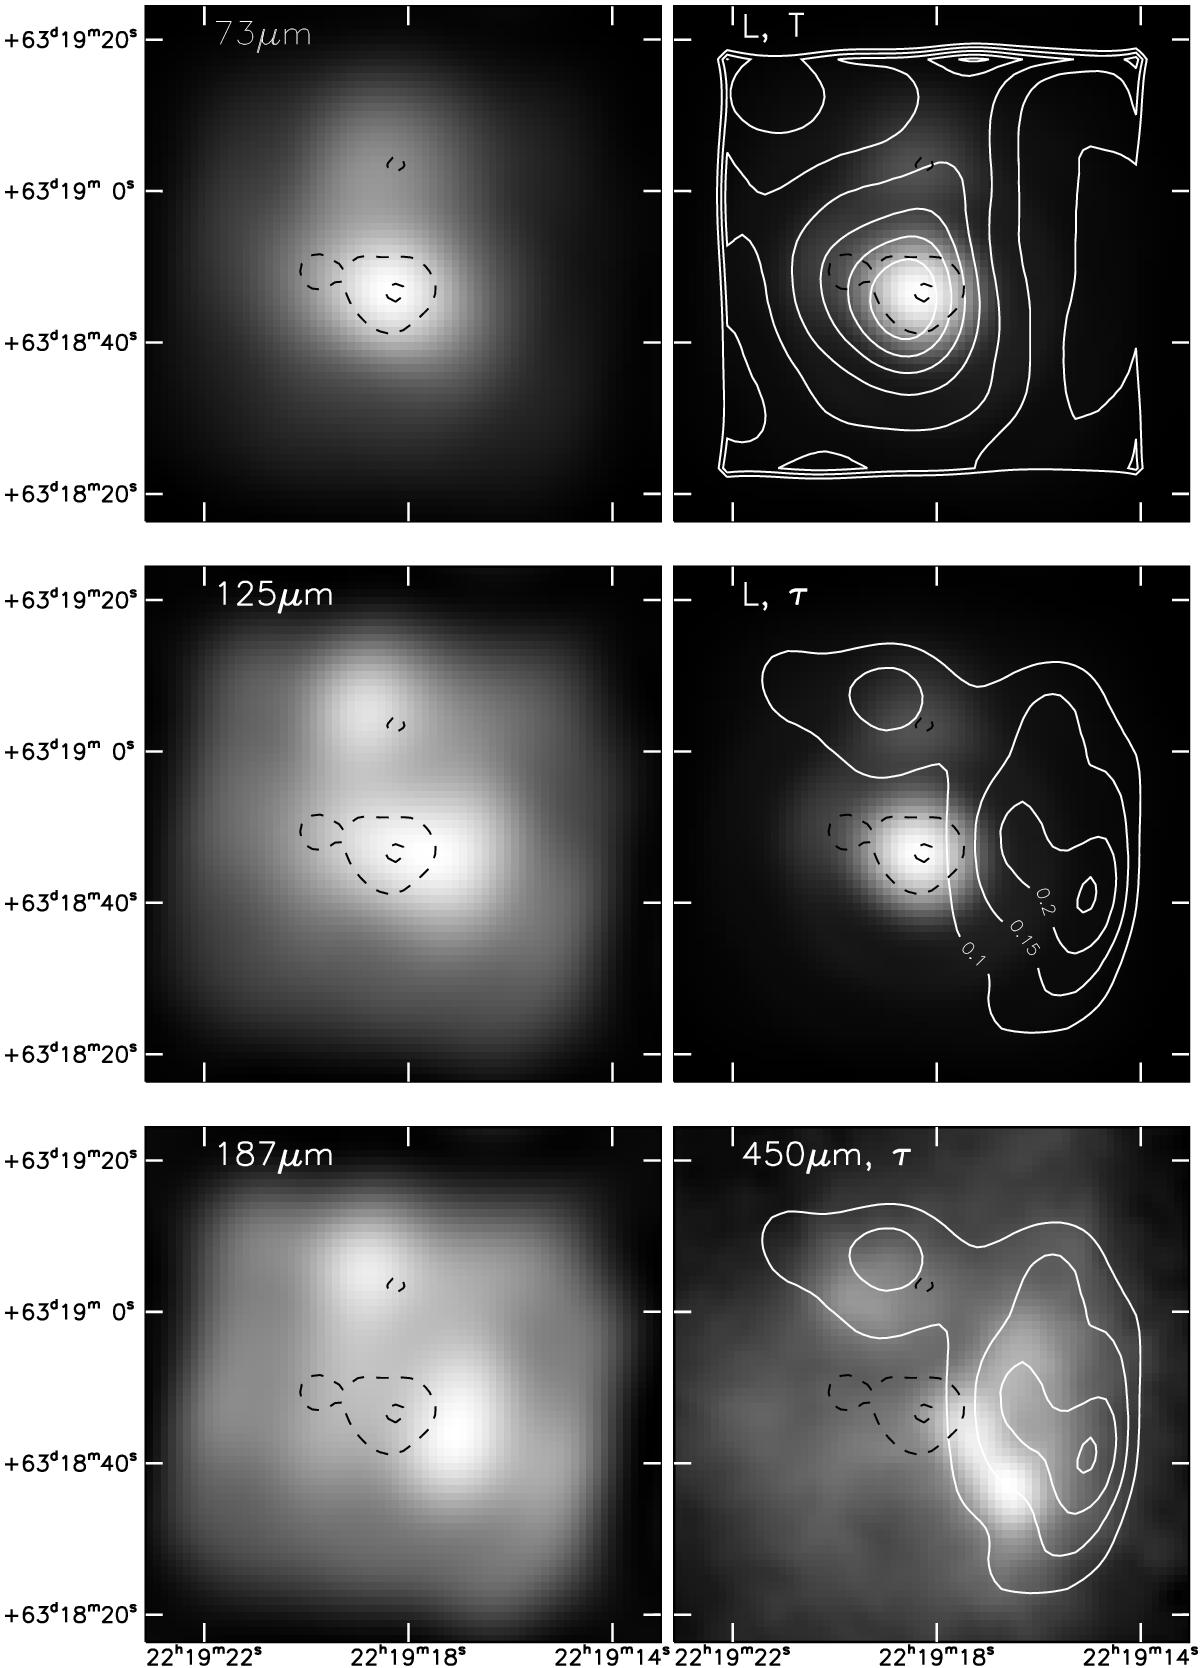
Left column: PACS/Spec continuum images (5 × 5 spatial array of 9′′ pixels regridded to a 1′′ grid) with contours of 37 μm (SOFIA) emission overlaid showing the positions of IRS 1, 2, and 3. Right column: top – total luminosity image with contours of fitted dust temperature at 70, 65, 60, ...K; center – luminosity image with contours of fitted dust optical depth at levels of 0.1, 0.15, 0.2, and 0.25; bottom – 450 μm SCUBA image with the same fitted dust optical depth contours overlaid.
Current usage metrics show cumulative count of Article Views (full-text article views including HTML views, PDF and ePub downloads, according to the available data) and Abstracts Views on Vision4Press platform.
Data correspond to usage on the plateform after 2015. The current usage metrics is available 48-96 hours after online publication and is updated daily on week days.
Initial download of the metrics may take a while.