Fig. 10
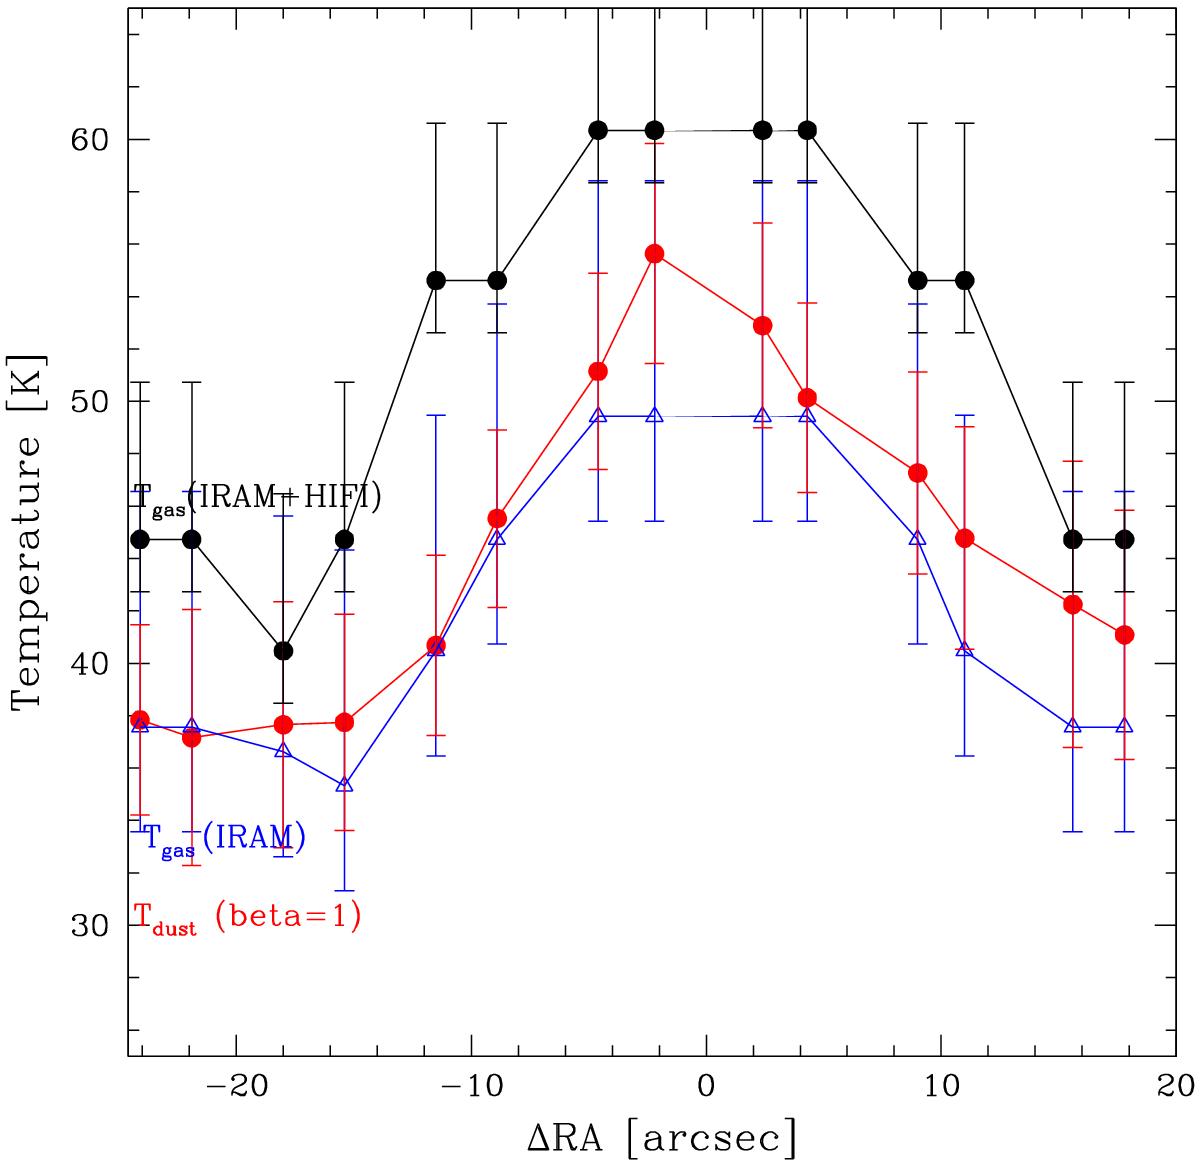
Temperatures of dust (red line) and gas along the HIFI cut. The gas temperature as derived fitting low-J lines (IRAM data, blue line) is systematically lower than the derived gas temperature fitting both low and high-J lines (IRAM and HIFI data, black line). Tgas (from both low and high-J lines) is systematically higher than Tdust, at least along this cut. The errors vary between ~5−15% throughout the cut with the higher accuracy close to the central position.
Current usage metrics show cumulative count of Article Views (full-text article views including HTML views, PDF and ePub downloads, according to the available data) and Abstracts Views on Vision4Press platform.
Data correspond to usage on the plateform after 2015. The current usage metrics is available 48-96 hours after online publication and is updated daily on week days.
Initial download of the metrics may take a while.