| Issue |
A&A
Volume 580, August 2015
|
|
|---|---|---|
| Article Number | A29 | |
| Number of page(s) | 6 | |
| Section | Astronomical instrumentation | |
| DOI | https://doi.org/10.1051/0004-6361/201425573 | |
| Published online | 23 July 2015 | |
A new 3 mm band receiver for the Onsala 20 m antenna
1 Group for Advanced Receiver Development, Department of Earth and Space Sciences, Chalmers University of Technology, 412 96 Gothenburg, Sweden
e-mail: Victor.Belitsky@chalmers.se
2 Department of Earth and Space Sciences, Chalmers University of Technology, Electronic Laboratory, Onsala Space Observatory, 439 92 Onsala, Sweden
3 Department of Earth and Space Sciences, Chalmers University of Technology, Onsala Space Observatory, 439 92 Onsala, Sweden
Received: 22 December 2014
Accepted: 29 May 2015
A new receiver for the Onsala 20 m antenna with the possibility of being equipped with 3 mm and 4 mm bands has been built and the 3 mm channel has been commissioned during the Spring 2014. For single-dish operation, the receiver uses an innovative on-source/off-source optical switch. In combination with additional optical components and within the same optical layout, the switch provides two calibration loads (for the 3 mm and 4 mm channels), sideband rejection measurement, and tuning possibilities. The optical layout of the receiver employs all cold (4 K) offset elliptical mirrors for both channels, whereas the on-off switch employs flat mirrors only. The 3 mm channel employs a sideband separation (2SB) dual polarization receiver with orthomode transducer (OMT), 4–8 GHz intermediate frequency (IF), x 2pol x upper and lower sidebands (USB + LSB). The cryostat has four optical windows made of high density polyethylene (HDPE) with anti-reflection corrugations, two for the signal and two for each frequency band cold load. The cryostat uses a two-stage cryocooler produced by Sumitomo HI RDK 408D2 with anti-vibration suspension of the cold-head to minimize impact of the vibrations on the receiver stability. The local oscillator (LO) system is based on a Gunn oscillator with aphase lock loop (PLL) and four mechanical tuners for broadband operation, providing independently tunable LO power for each polarization. This paper provides a technical description of the receiver and its technology and could be useful for instrumentation engineers and observers using the Onsala 20 m telescope.
Key words: telescopes / instrumentation: detectors
© ESO, 2015
1. Introduction
The Onsala Space Observatory’s 20 m diameter antenna1, is located on the west coast of Sweden. The 20 m telescope is used for single-dish spectral line observations as well as geodetic and astronomical very large base interferometry (VLBI). The antenna is presently equipped with receivers covering 2.2–2.4 GHz, 8.2–8.4 GHz, and 18–50 GHz; a new dual-band receiver, as described in this paper, is now being installed to cover the frequency ranges 70–87 GHz (4 mm) and 85–116 GHz (3 mm). The 3 mm channel is now fully operational, while the 4 mm channel is scheduled for completion before the end of 2015. This paper describes the common optics and other components of the joint 3 mm/4 mm receiver assembly, and then the detailed design and performance of the 3 mm channel. A subsequent paper will describe the final design and performance of the 4 mm channel. The main observational goals of the completed 3 mm channel are to make single-dish molecular spectroscopy observations up to 116 GHz (the CO(1–0) line) and to participate in millimeter wavelength VLBI observations within the Global VLBI Millimetre Array (GMVA). The main observing goal of the 4 mm channel is to study deuterated molecules in the interstellar medium, many of which have never been surveyed extensively by any telescope before. To speed implementation at 3 mm it was decided to incorporate existing 2SB SIS mixers (Maier et al. 2007) while at 4 mm existing high electron mobility transistor (HEMT) amplifiers (Bryerton et al. 2013) were used. Both receiver channels are designed to be dual polarization with OMTs and all-cold optics at 4 K physical temperature giving receiver temperatures of approximately 50K. Under good weather conditions, which typically occur in colder winter conditions, the new 3 mm channel system temperature (including atmospheric opacity) has been measured to be ~100 K. Together with the replacement of the aging 20 m antenna radome – a project that was completed in September 2014 – and an ongoing improvement in the backend spectrometer capacity, a multi-year refurbishment program designed to significantly improve its millimeter wavelength observing capabilities will soon be completed at the 20 m Onsala telescope.
2. Receiver design
2.1. Cryostat
Figure 1 presents the interior of the cryostat with the 3 mm receiver channel. In Fig. 2 we present the receiver block diagram. The cryostat is built around a two-stage Sumitomo RDK-408D2 cryocooler with 1 W at 4 K lift-off power. We have implemented an anti-vibration suspension of the cryocooler by using a bellows between the 300 K flange of the RDK-408D2 cryocooler and the cryostat to keep the vacuum, with the vibration-damping rubber elements installed at the brackets providing the mechanical attachment of the cryocooler to the cryostat bottom plate. All thermal links between the cryocooler temperature stages and the elements of the receiver are made with flexible thermal contacts using braided 0.05 mm diameter oxygen-free copper wires with each thermal link having a 6 mm2 cross-section area. This ensures that the vibration of the cryocooler is not transferred to the receiver, its supporting structure, and the cryostat.
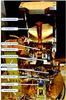 |
Fig. 1 Interior of the receiver cryostat. 3 mm receiver channel. |
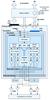 |
Fig. 2 Receiver layout and signal chain components. |
The cryostat vacuum vessel is made of two aluminum plates and a stainless steel tube interconnected using standard ISO-K flanges. The tube has three ports to connect the vacuum pump, a vacuum gauge, and the venting valve. All vacuum sealing is made with VitonTM O-rings. The 4 RF windows (two windows per channel, one for the RF signal, the other for the cold load) in the top plate are made of HDPE and use anti-reflection corrugations shaped as straight ridges with a triangular cross section milled in the HDPE; the corrugations at the vacuum side are rotated 90° with respect to the corrugations at the air side of the RF window.
In order to reduce the radiation load to the 4 K parts of the receiver, the thermal shield attached to the 50 K stage has a double-shell construction. In this double-shell design, the outer shell takes the major radiation load from the 300 K surrounding, and its temperature could be as high as 110–120 K; the inner shell temperature stays close to 50 K, the temperature of the cryocooler first stage temperature deck. The two temperature decks of the cryostat, 4 K and 50 K, are made of massive gold-plated oxygen-free copper plates. The mechanical support structure is assembled from flat fiberglass panels (Fig. 1) arranged to provide a rigid construction that also provides thermal isolation between the different temperature decks inside the cryostat and the room temperature reference plate. The entire inner mechanical structure was simulated using AnsysTM FESS to verify that eigenfrequencies exceed 65 Hz and the gravity deflection is less than 25 μm (at the top of the second mirror with respect to the reference at the base plate; see Fig. 1). The outer thermal shields are made of pure aluminum using welding and bolted caps of aluminum alloy. In the outer shell cap, the two cold calibration loads (one for each frequency channel) are installed; the loads are produced using the technology suggested by Klaassen et al. (2002). Each load has an integrated temperature sensor to provide accurate data on the physical temperature used for the receiver noise temperature and gain calibration. The RF windows and the loads of the thermal shield are protected by ZitexTM IR filters (multi-layer) against the 300 K thermal background.
Each receiver channel interface at the bottom bulkhead has a cartridge-like design with all feed-throughs integrated into the interface flange. For the LO feeds, AerowaveTM WR10 vacuum feed-throughs were used; Fisher© multi-pole vacuum feed-throughs were used for the DC bias of the SIS mixers, IF amplifiers, and thermal sensors; and Huber+Suhner© SMA bulkhead vacuum feed-throughs for the four IF signals.
The cryostat temperature monitoring and control are done via aCryoConTM cryogenic temperature controller, Model 24C, which allows stabilizing the 4 K temperature deck to facilitate the gain stability of the SIS mixers, which is strongly dependent on the physical temperature. In addition, the CryoConTM signal from the cryogenic temperature sensors is used by the computerized receiver control system to initiate a receiver shutdown in case the temperature rises above the safe level for the SIS mixers. The typical cool-down time of the receiver is around 6.5 h.
2.2. Optics
The 3 mm channel optics inside the cryostat largely resembles the layout used in the design of the ALMA Band 5 cartridge (Billade et al. 2012) and consists of two offset elliptical mirrors in combination with a corrugated feed-horn (Fig. 1). The optics is designed for 5ω0 beam clearance. The initial design of the optics included a Gaussian beam analysis to find the position of the mirrors and the horn to provide frequency-independent illumination of the secondary using a procedure similar to Baryshev & Wild (2001). For the given layout, an extensive optimization procedure was run to obtain the corrugation pattern of the feed-horn. The optimization used an in-house developed software including a mode-matching calculation of the electro-magnetic (EM) field at the feed-horn aperture, conversion of the field into a Gaussian beam, propagation of the found EM field through the mirrors to the secondary, and calculation of the illumination of the secondary (edge-taper and the Gaussivity of the beam); all these steps are looped into a simplex optimization procedure. The optimization yielded the optimum corrugations of the feed-horn and was finally verified for the entire optics using physics optic simulations with the GRASPTM software.
In order to reduce the noise-contribution of the atmosphere, the receiver uses a beam-switching scheme with about five widths of the antenna beam displacement between the on-source and off-source positions. The beam switch uses the novel layout depicted in Figs. 3a,b.
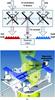 |
Fig. 3 a) Beam switch principle. b) CAD generated 3D picture of the receiver beam switch. The arrow in the picture shows the direction of the reciprocating motion for the F1 and F2 mirrors. |
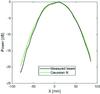 |
Fig. 4 Comparison of the measured input beam cross section and the target Gaussian beam. |
Figure 3a provides a schematic diagram that explains the beam switch principle. For the 3 mm channel, the beam switch employs two flat mirrors (F1 and F2 in Fig. 3a). These two mirrors are placed at a 45° angle to the receiver input beam axis and at a 90° angle to each other, one behind the other in the plane perpendicular to the plane of the drawing in Fig. 3a (see Fig. 3b for a 3D representation of the beam switch system). The mirrors F1 and F2 are placed on the moving platform that provides a reciprocating motion in the direction perpendicular to the plane of Fig. 3a in such manner that either mirror F1 or F2 is positioned against the receiver input window. The movement is arranged by using a crankshaft-like mechanism driven by a motor. An additional pair of flat mirrors F3R and F3L at a nominal angle of 45° (position P1 for F3R and position P2 for F3L) picks up the antenna beam at the ON or OFF positions and reflects the signal beam into the receiver input via either mirror F1 (dashed line arrows) or mirror F2 (solid black arrows) depending on the cycled positioning of either of the mirrors F1 and F2 against the beam as depicted in Fig. 3a. The mirrors F3R and F3L can be rotated around their center such that instead of the sky positions, ON and OFF, the receiver input is directed to either the hot or cold loads (position P2 for F3R and position P1 for F3L, Fig. 3a; corresponding beam paths are depicted by blue or red arrows). The advantage of this switching technique is that signal blanking is required only when the receiver beam is exposed to the two moving mirrors, F1 and F2, and this occurs when the moving platform travels at maximum speed of the crankshaft transmission. The signal blanking time could be further minimized by employing a variable rotation speed of the programmable stepper-motor driving the platform. No blanking of the signal is required when the moving mirrors reach the dead-center positions as no mechanical transients occur at these points. The linear size of the mirrors F1 and F2 is chosen about 1.5 × 5.2ω0 in length and 5.2ω0 in height with a correction factor 1.41 for a 45° angle. As the 3 mm receiver channel and 4 mm receiver channel are placed next to each other, they share one (middle) mirror F1; for the 4 mm channel we added yet another mirror (F2’) as depicted in Fig. 3b.
2.3. 3 mm mixer assembly and local oscillator
The receiver dual-polarization capabilities are implemented via an OMT, which is a scaled-down version of the ALMA Band 5 OMT. The mixer assembly uses a“monolithic” design where especially constructed waveguide parts provide direct connection of the OMT, the 2SB mixer assemblies, and the LO feeds with the IF chain components being attached to the IF hybrid outputs directly without cables. In order to keep the two polarizations layout identical, we used a compact 90-degree waveguide WR10 twist (Litvinov et al. 2010) fabricated by milling. Employing such a twist allows us to harmonize the LO feed components and the IF chain layout to be the same for both polarizations and sidebands.
The receiver IF chain consists of four identical branches for each polarization and USB/LSB combination. The IF band is chosen to be 4–8 GHz mainly based on backend limitations, whereas the IRAM 2SB mixers are able to provide 4–12 GHz. The IF chain is built of components having matched SMA contacts, which allow us to avoid using any interconnecting cables starting from the IF 90-degree hybrid. The isolators from QuinStar Technology, Inc., are equipped with aDC/RF isolated contact at the terminated port. This contact is used for DC biasing of the SIS mixer junctions. The IF amplifiers are produced in house; they use commercially available GaAs HEMT transistors in a three-stage design (Sundin 2006). The details of the 3 mm mixer assembly can be seen in Fig. 1.
The LO source employs a Gunn oscillator with a PLL because of its superior generated RF power allowing the use of single LO source for both polarizations and, correspondingly, the four SIS mixers, providing stability and low AM noise. In return, we have to use two mechanical tuners for the Gunn oscillator and additionally two more to independently adjust the LO power for each polarization by regulating variable waveguide attenuators. The LO high-frequency chain consists of a Carlstrom Gunn oscillator followed by a directional coupler (PLL), the waveguide 3 dB power splitter, and two adjustable waveguide attenuators. All mechanical tuners use DC motors with built-in resistive position sensors and are controlled by computer via a servo-loop. The Gunn oscillator is thermally stabilized at 35 °C to reduce thermal drifts. The PLL system uses a commercial synthesizer that is locked on the reference maser at ~4×100 MHz. For VLBI observations, the LO reference is changed to a dual loop phase locked coaxial resonator oscillator (DLCRO) locked to the reference maser at ~100 MHz. Although we have not performed tests of the receiver phase stability, we use a very similar LO system to the previous generation of the 3 mm receiver and assume that it has acceptable performance. Furthermore, thermal stabilization of the receiver cryogenic part (CryoCon, Model 24C) allows further stabilization of the SIS mixer and the cryo-LNAs gain contributing positively to the overall receiver amplitude and phase stability.
3. Receiver control
The receiver is controlled by a Tcl/Tk-script that provides the user with a set of different graphical user interface (GUI) windows. This script can be run either in stand-alone mode or as a part of the Pegasus observing system used at the Onsala 20 m telescope. Communication with the different pieces of hardware is handled by a set of independent C-programs. These programs fulfil a double role since they serve as communication servers for requests from the control script, as well as providers of monitoring data, by periodically reading out and multicasting such data to monitors, loggers, and alarm programs.
4. Receiver commissioning on the Onsala 20 m antenna
The 3 mm receiver was first installed at the Onsala 20 m antenna in March 2014 to allow for initial evaluation and telescope commissioning to occur. After a few observation projects had been successfully completed, the receiver was disassembled again for upgrades during the summer 2014. The receiver was reinstalled in November 2014 and the performance results below were measured in December 2014.
4.1. 3 mm band receiver capabilities at the 20 m antenna
The Onsala 20 m telescope is a 19.81 m diameter dish on an azimuth/elevation mount with a Cassegrain-type sub-reflector system. A 30 m radome (replaced in September 2014)protects the telescope, making observations in most weather conditions feasible. The transmission losses due to the radome are in the range 5–20% for the frequency range 86–115 GHz. The main beam efficiency varies with frequency and elevation and is in the range 0.48–0.58 at 86 GHz and 0.35–0.47 at 115 GHz for elevations above about45°. Three observing modes are available for the 3 mm receiver: position switching (PSW), frequency switching (FSW), and beam switching (BSW). The last is implemented by the beam switch (Sect. 2.2) that alternates the optical path to the receiver entry window via two mirrors at different positions in the focal plane that in turn face the sub-reflector along symmetric paths. The optical path through one mirror always faces the source while the other observes a blank reference position. The on-sky throw between the two positions is about 11′ in azimuth. This approach is similar to sub-reflector wobbling and is very effective at producing flat baselines. The switching frequency is 0.5–1 Hz for BSW and typically 5 Hz for FSW observation modes.
The 3 mm receiver band produces four IF outputs from dual polarization and two sidebands. At the time of writing, a transition from 1 GHz backend to 4 GHz is ongoing. The goal is to fully cover the 4 × 4 GHz bandwidth (2 sidebands, 2 polarizations) with new fast Fourier transformer (FFT) broadband spectrometers. Since January 2015, 2 × 2.5 GHz spectrometers are available as the first step in this upgrade. The spectral resolution for the newest backend varies with the bandwidth mode selected; for the widest bandwidth (2.5 GHz), it is 76 kHz. The best resolution, 5 kHz, is available for bandwidths of 156 MHz. In addition, the telescope is fully equipped to participate in millimeter VLBI experiments using MarkV and DBBC backends.
4.2. Commissioning results
4.2.1. Receiver performance
Receiver noise temperatures were measured using the two loads built into the cryostat and employing the beam-switch. The internal cryogenic load was calibrated by applying Y-factor measurement for the receiver gain calibration and further measurement of the brightness temperature measurement of the built-in cold calibration load. It was found that an equivalent effective blackbody temperature of the cold calibration load is 79 K.
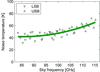 |
Fig. 5 Example of the receiver noise measured at the antenna. Measured SSB receiver noise for one of two polarizations. We note that the values are uncorrected for sideband leakage, typically less than 7%. |
Figure 5 shows some results from noise measurements with the receiver installed in the telescope under operational conditions. The green line is a quadratic fit to the points shown. The values are uncorrected for sideband leakage, but this correction is small, at most about 7%, although typically less. The data were taken from automated test runs exploring the parameter space in terms of the mixer DC bias voltage and LO power, using the built-in hot load and the internal cold load. Typically they represent the lowest values found but higher noise values were traded for better sideband rejection in a few cases. The scatter between nearby frequencies is largely due to the coarseness of the DC bias and LO power search grid, and due to the deviation of the internal cold load from a perfect blackbody. Changing environmental conditions during the four-day measurement run may also contribute to the measurement scatter. While not shown here, the noise temperature pattern vs. frequency and its values were found to be very similar in the other polarization. Sideband rejection ratios were measured by injecting test signals at a few different spectral offsets in the upper and lower sidebands for each LO frequency (Kerr et al. 2001). The sideband rejection ratio averaged across the central 250 MHz of the IF band was found to be typically ~15 dB. However, for certain LO and RF frequencies, the ratio varies substantially. In many cases, the rejection is so high that it cannot be measured reliably since non-linearity effects kick in when high settings for the test signal power are required. In a few cases, the SIS mixer bias setting that produced the lowest receiver noise yielded rejection values below the design goal of 10 dB. Better rejections can be traded for slightly higher noise by choosing a different mixer bias point.
4.2.2. On-sky results
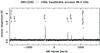 |
Fig. 6 Example of the baseline stability: 47.5 min of on-source integration time without any baseline subtracted. This early test was done in non-optimum conditions (partly raining and using position switching, which is more sensitive to unstable weather). |
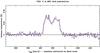 |
Fig. 7 A M82 CS J = 2–1 spectrum observed in beam-switch mode with 8.8 h on-source time. The black and violet lines correspond to the local horizontal and vertical polarization components. |
Early tests show the expected low noise temperature of the receiver and an impressive baseline stability, see Figs. 6 and 7. The latter feature also includes improved resilience against unstable weather and RFI, e.g., no baseline was subtracted in Fig. 6 and it was observed in poor weather conditions (partly raining). The on-source time was 47.5 min using only one polarization due to earlier limitations in the backend spectrometer.
Only a fixed level was subtracted from the baselines in Fig. 7, which shows the CS J = 2–1 line at 97.8 GHz in the galaxy M82. The observation lasted for 8.8 h on-source time; simultaneous results with the two polarizations are shown. The channels were re-sampled to create a resolution of 10 km s-1.
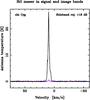 |
Fig. 8 Lower and upper sideband spectra of χ Cyg when tuned to SiO J = 2–1 (v = 1) at 86.2 GHz in the lower sideband. The sideband rejection was found to be 18.5 dB (expected 18.1 dB from test signal result). |
The results from sideband rejection measurements based on the test signals were validated on-sky. Figure 8 shows an example where a strong SiO maser from the circumstellar envelope
of χ Cyg at 86.2 GHz is detected very close to the predicted level (in the image band at 99.4 GHz). More results from early on-sky commissioning can be found at the Chalmers/Onsala webpage2.
5. Conclusions
This paper could be interesting for instrumentation engineers and scientists building receivers for single-dish observations. It also provides a reference for observers using the Onsala Space Observatory 20 m telescope and the new 3 mm receiver. The receiver employs a dual-polarization 2SB SIS mixer front-end, has built-in calibration capabilities, and uses an innovative beam switch. The new receiver shows very good noise (around 40 K SSB, 83–104 GHz and 55 K SSB, 104–116 GHz) and sideband rejection averages around 15 dB, although it occasionally drops to around 10 dB. The receiver provides the possibility for observations in a total of 16 GHz (two polarizations and USB+LSB) of the IF band. In the Fall of 2015, we plan to further upgrade the receiver by adding the 4 mm channel. At the time of writing, only a few items related to the receiver and optical path remain to be tested on the telescope, namely the full 4 GHz band-pass performance (pending upgrade of the IF backend system in 2015), the frequency switching observation mode, and minor improvements in the beam-switching rate and cycle symmetry.
Information on how to apply for time at the Onsala telescopes can be found online3.
References
- Baryshev, A., & Wild, W. 2001, in ALMA Memo, 394, ALMA, 1 [Google Scholar]
- Billade, B., Nystrom, O., Meledin, D., et al. 2012, Terahertz Science and Technology, IEEE Transactions on, 2, 208 [Google Scholar]
- Bryerton, E., Morgan, M., & Pospieszalski, M. 2013, in Radio and Wireless Symposium (RWS), IEEE, 358 [Google Scholar]
- Kerr, A., Pan, S., & Effland, J. 2001, NRAO, Charlottesville, VA, ALMA Memo, 357 [Google Scholar]
- Klaassen, T., Blok, J., Niels Hovenier, J., et al. 2002, in Terahertz Electronics Proceedings, 2002, IEEE Tenth International Conference on, 32 [Google Scholar]
- Litvinov, V., Rud, L., & Sverdlenko, E. 2010, Radioelectronics and Communications Systems, 53, 162 [CrossRef] [Google Scholar]
- Maier, D., Billon-Pierron, D., Reverdy, J., & Schicke, M. 2007, in 18th International Symposium on Space Terahertz Technology (ISSTT), 2007, 260 [Google Scholar]
- Sundin, E. 2006, Thesis for the Degree of Licentiate of Engineering, Technical report 2006:9L, Chalmers University of Technology [Google Scholar]
All Figures
|
Fig. 1 Interior of the receiver cryostat. 3 mm receiver channel. |
| In the text | |
|
Fig. 2 Receiver layout and signal chain components. |
| In the text | |
|
Fig. 3 a) Beam switch principle. b) CAD generated 3D picture of the receiver beam switch. The arrow in the picture shows the direction of the reciprocating motion for the F1 and F2 mirrors. |
| In the text | |
|
Fig. 4 Comparison of the measured input beam cross section and the target Gaussian beam. |
| In the text | |
|
Fig. 5 Example of the receiver noise measured at the antenna. Measured SSB receiver noise for one of two polarizations. We note that the values are uncorrected for sideband leakage, typically less than 7%. |
| In the text | |
|
Fig. 6 Example of the baseline stability: 47.5 min of on-source integration time without any baseline subtracted. This early test was done in non-optimum conditions (partly raining and using position switching, which is more sensitive to unstable weather). |
| In the text | |
|
Fig. 7 A M82 CS J = 2–1 spectrum observed in beam-switch mode with 8.8 h on-source time. The black and violet lines correspond to the local horizontal and vertical polarization components. |
| In the text | |
|
Fig. 8 Lower and upper sideband spectra of χ Cyg when tuned to SiO J = 2–1 (v = 1) at 86.2 GHz in the lower sideband. The sideband rejection was found to be 18.5 dB (expected 18.1 dB from test signal result). |
| In the text | |
Current usage metrics show cumulative count of Article Views (full-text article views including HTML views, PDF and ePub downloads, according to the available data) and Abstracts Views on Vision4Press platform.
Data correspond to usage on the plateform after 2015. The current usage metrics is available 48-96 hours after online publication and is updated daily on week days.
Initial download of the metrics may take a while.