Fig. 7
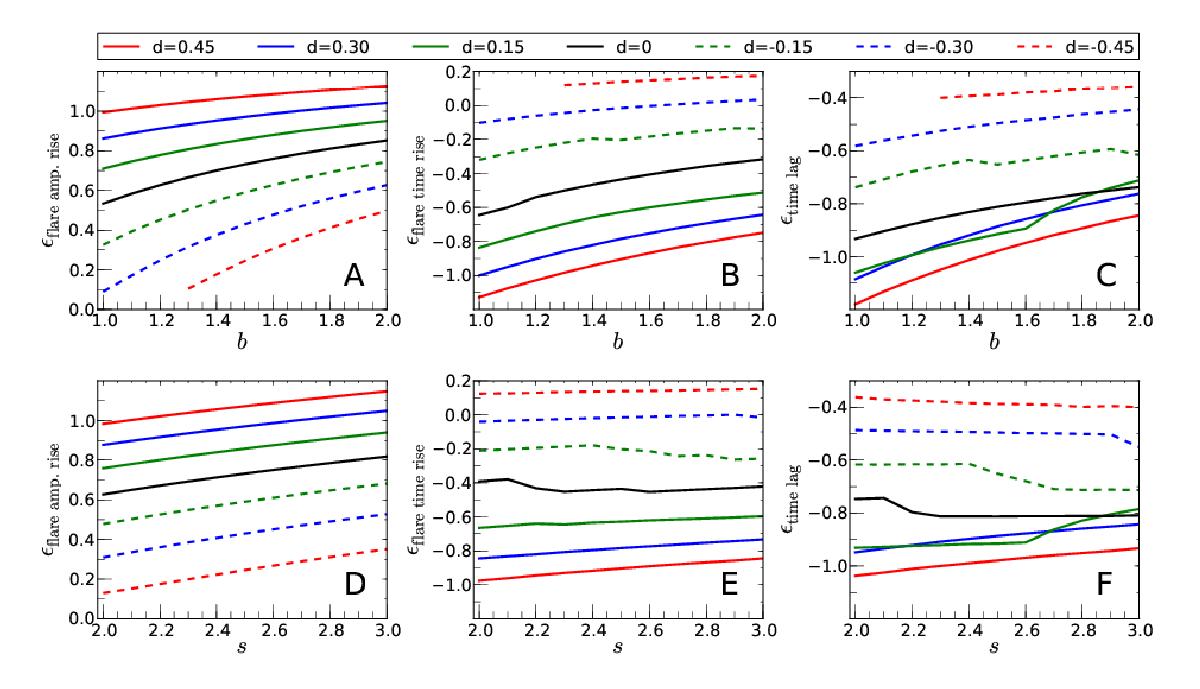
Exponents of the light curve parameters obtained from the synthetic light curves from left to right: flare amplitude, flare time scale and cross band delay exponent. The top panels (A–C) show the variation in the light curve parameters using a fixed spectral slope of s = 2.5 and the bottom panels (D–F) present the changes in the parameters for a fixed helical magnetic field (b = 1.5). The different values for d are colour-coded and can be found in the plot legend.
Current usage metrics show cumulative count of Article Views (full-text article views including HTML views, PDF and ePub downloads, according to the available data) and Abstracts Views on Vision4Press platform.
Data correspond to usage on the plateform after 2015. The current usage metrics is available 48-96 hours after online publication and is updated daily on week days.
Initial download of the metrics may take a while.