Fig. 6
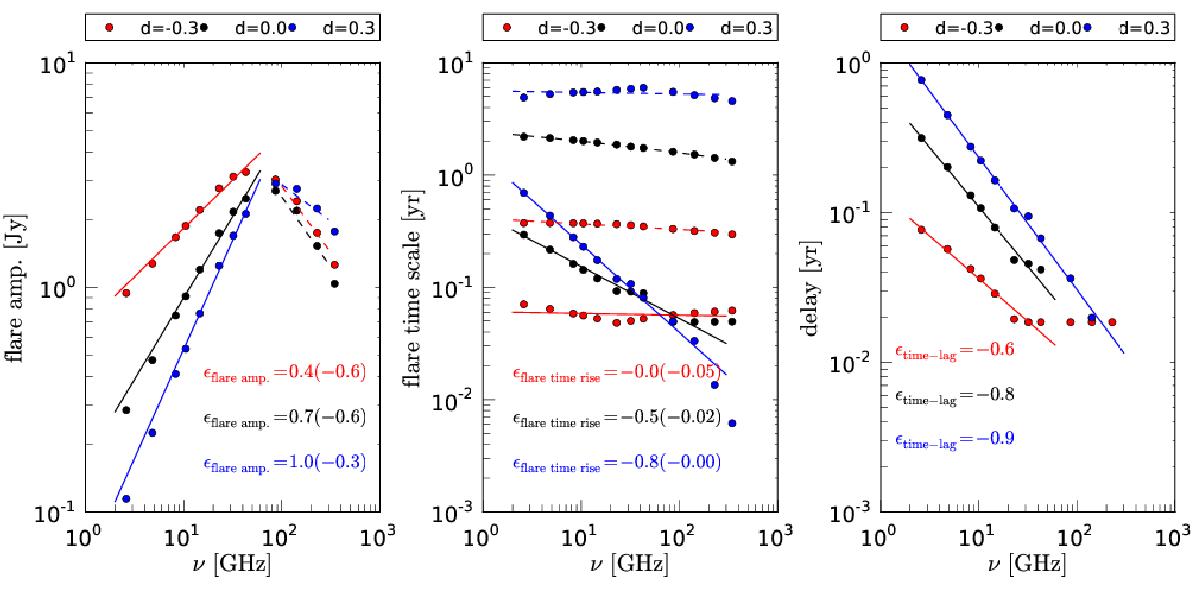
Light curve parameters obtained from synthetic light curves with three different values of d while keeping b = 1.5, s = 2.5, ρ = 1, and k = 3.0 fixed. The panels show from left to right the flare amplitude, the flare time scale and the cross-band delays with respect to the peak of the 345 GHz light curve. The solid lines correspond to the power law fits and the exponents are given in the plots. The values in brackets correspond to the exponents of a power law fit to the decaying regime of flare amplitude and flare time scale.
Current usage metrics show cumulative count of Article Views (full-text article views including HTML views, PDF and ePub downloads, according to the available data) and Abstracts Views on Vision4Press platform.
Data correspond to usage on the plateform after 2015. The current usage metrics is available 48-96 hours after online publication and is updated daily on week days.
Initial download of the metrics may take a while.