Fig. 2
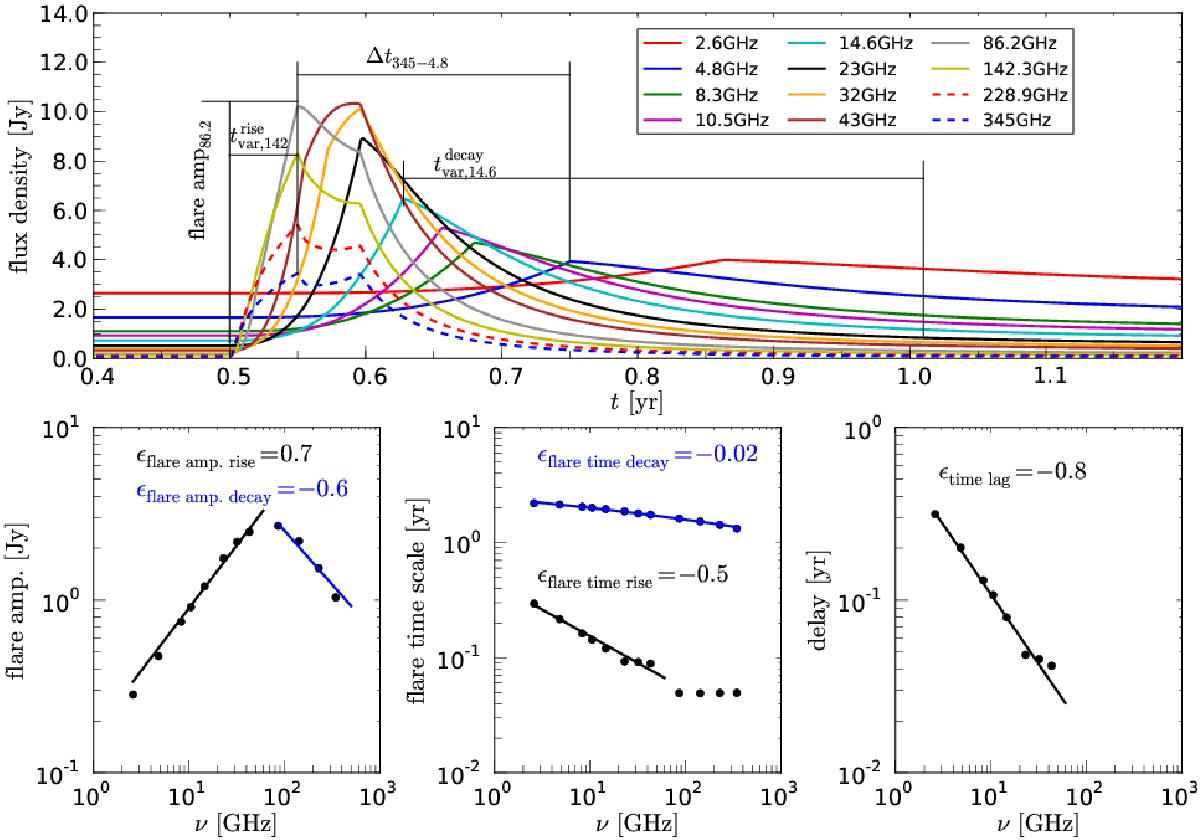
Example for the analysis of the synthetic single-dish light curves. Top panel: the single-dish multi-frequency light curves (2.6 to 345 GHz) computed for b = 1.5, s = 2.5, k = 3.0, ρ = 1.0, and d = 0 (see also Fig. 1). Bottom panels, from left to right: flare amplitudes, flare time scales and cross-band delays. The solid lines correspond to power law fits and the exponent is given in the plots.
Current usage metrics show cumulative count of Article Views (full-text article views including HTML views, PDF and ePub downloads, according to the available data) and Abstracts Views on Vision4Press platform.
Data correspond to usage on the plateform after 2015. The current usage metrics is available 48-96 hours after online publication and is updated daily on week days.
Initial download of the metrics may take a while.